Structural changes occurring in the U.S. economy—including the several decades’ long transition from a manufacturing and goods-based orientation to an economy that is driven by creativity, knowledge, and the provision of high-value services—have increased the economic importance of human capital and workforce skills. In the old economy, some rural areas could successfully compete for business activity by providing relatively affordable land, compared to urban centers, and inexpensive labor with a skill set tailored to making and moving goods. Still many other rural areas built an economy around proximity to key natural resources and recreational amenities. Very few places outside of metropolitan areas, however, have economies that are currently driven by innovation and technology.
The so-called “new economy” presents challenges to rural policymakers in that the process of innovation and technology development, and the provision of high-value services benefit greatly from a large agglomeration of customers and high human capital workers, a combination that is rarely found outside of cities. Although advances in information technology and electronic communications have dramatically reduced the costs of moving information, they have not—perhaps contrary to expectations—diminished the importance of face-to-face contact that is facilitated by dense urban markets (Gaspar and Glaeser, 1998; Storper and Venables, 2004). Taken together, these forces suggest that substantial differences exist between rural and urban areas in terms of the types of skills available in the workforce, and these differences are likely to have measurable effects on indicators of regional growth and development. The purpose of this article is to examine differences in the skills of rural areas compared to the overall U.S. economy, and then to describe how these differences in skill might influence rural economic vitality and employment growth prospects going forward.
Our general approach is to use the occupations present in a region to determine the types of skills that are available in the workforce. Focusing on occupations is key because they provide a better indication of the exact skills used on the job than educational attainment, which simply tells us how many years of schooling a person has completed. Perhaps the best known example of an occupational-based approach is Richard Florida’s (2002) empirical method of measuring the Creative Economy, which is made-up of a collection of occupations—for example, artists, scientists, and educators—that are similar in their high demands for on-the-job creativity. Our method is similar, but we use a cluster analysis technique that allows us to form groups of occupations that are similar based on the importance of a wide range of skills. This approach requires detailed occupational employment data for regions of the United States that are classified as rural areas.
The first part of our analysis involves identifying rural areas of the United States based on their proximity to a central city and population density. This is the same general approach used in other rural-urban classification systems, such as Beale Codes and the USDA’s rural-urban continuum codes that assign a score on a scale of 1 to 9 to all U.S. counties. In our analysis, we are unable to use the existing rural-urban codes because the occupation-level data needed to examine workforce skills is not readily available for counties, but rather a different unit of geography referred to as a “PUMA” (Public Use Microdata Area). Defined by the U.S. Census Bureau, PUMAs range in geographic scope from smaller than a county to areas that cover multiple counties.
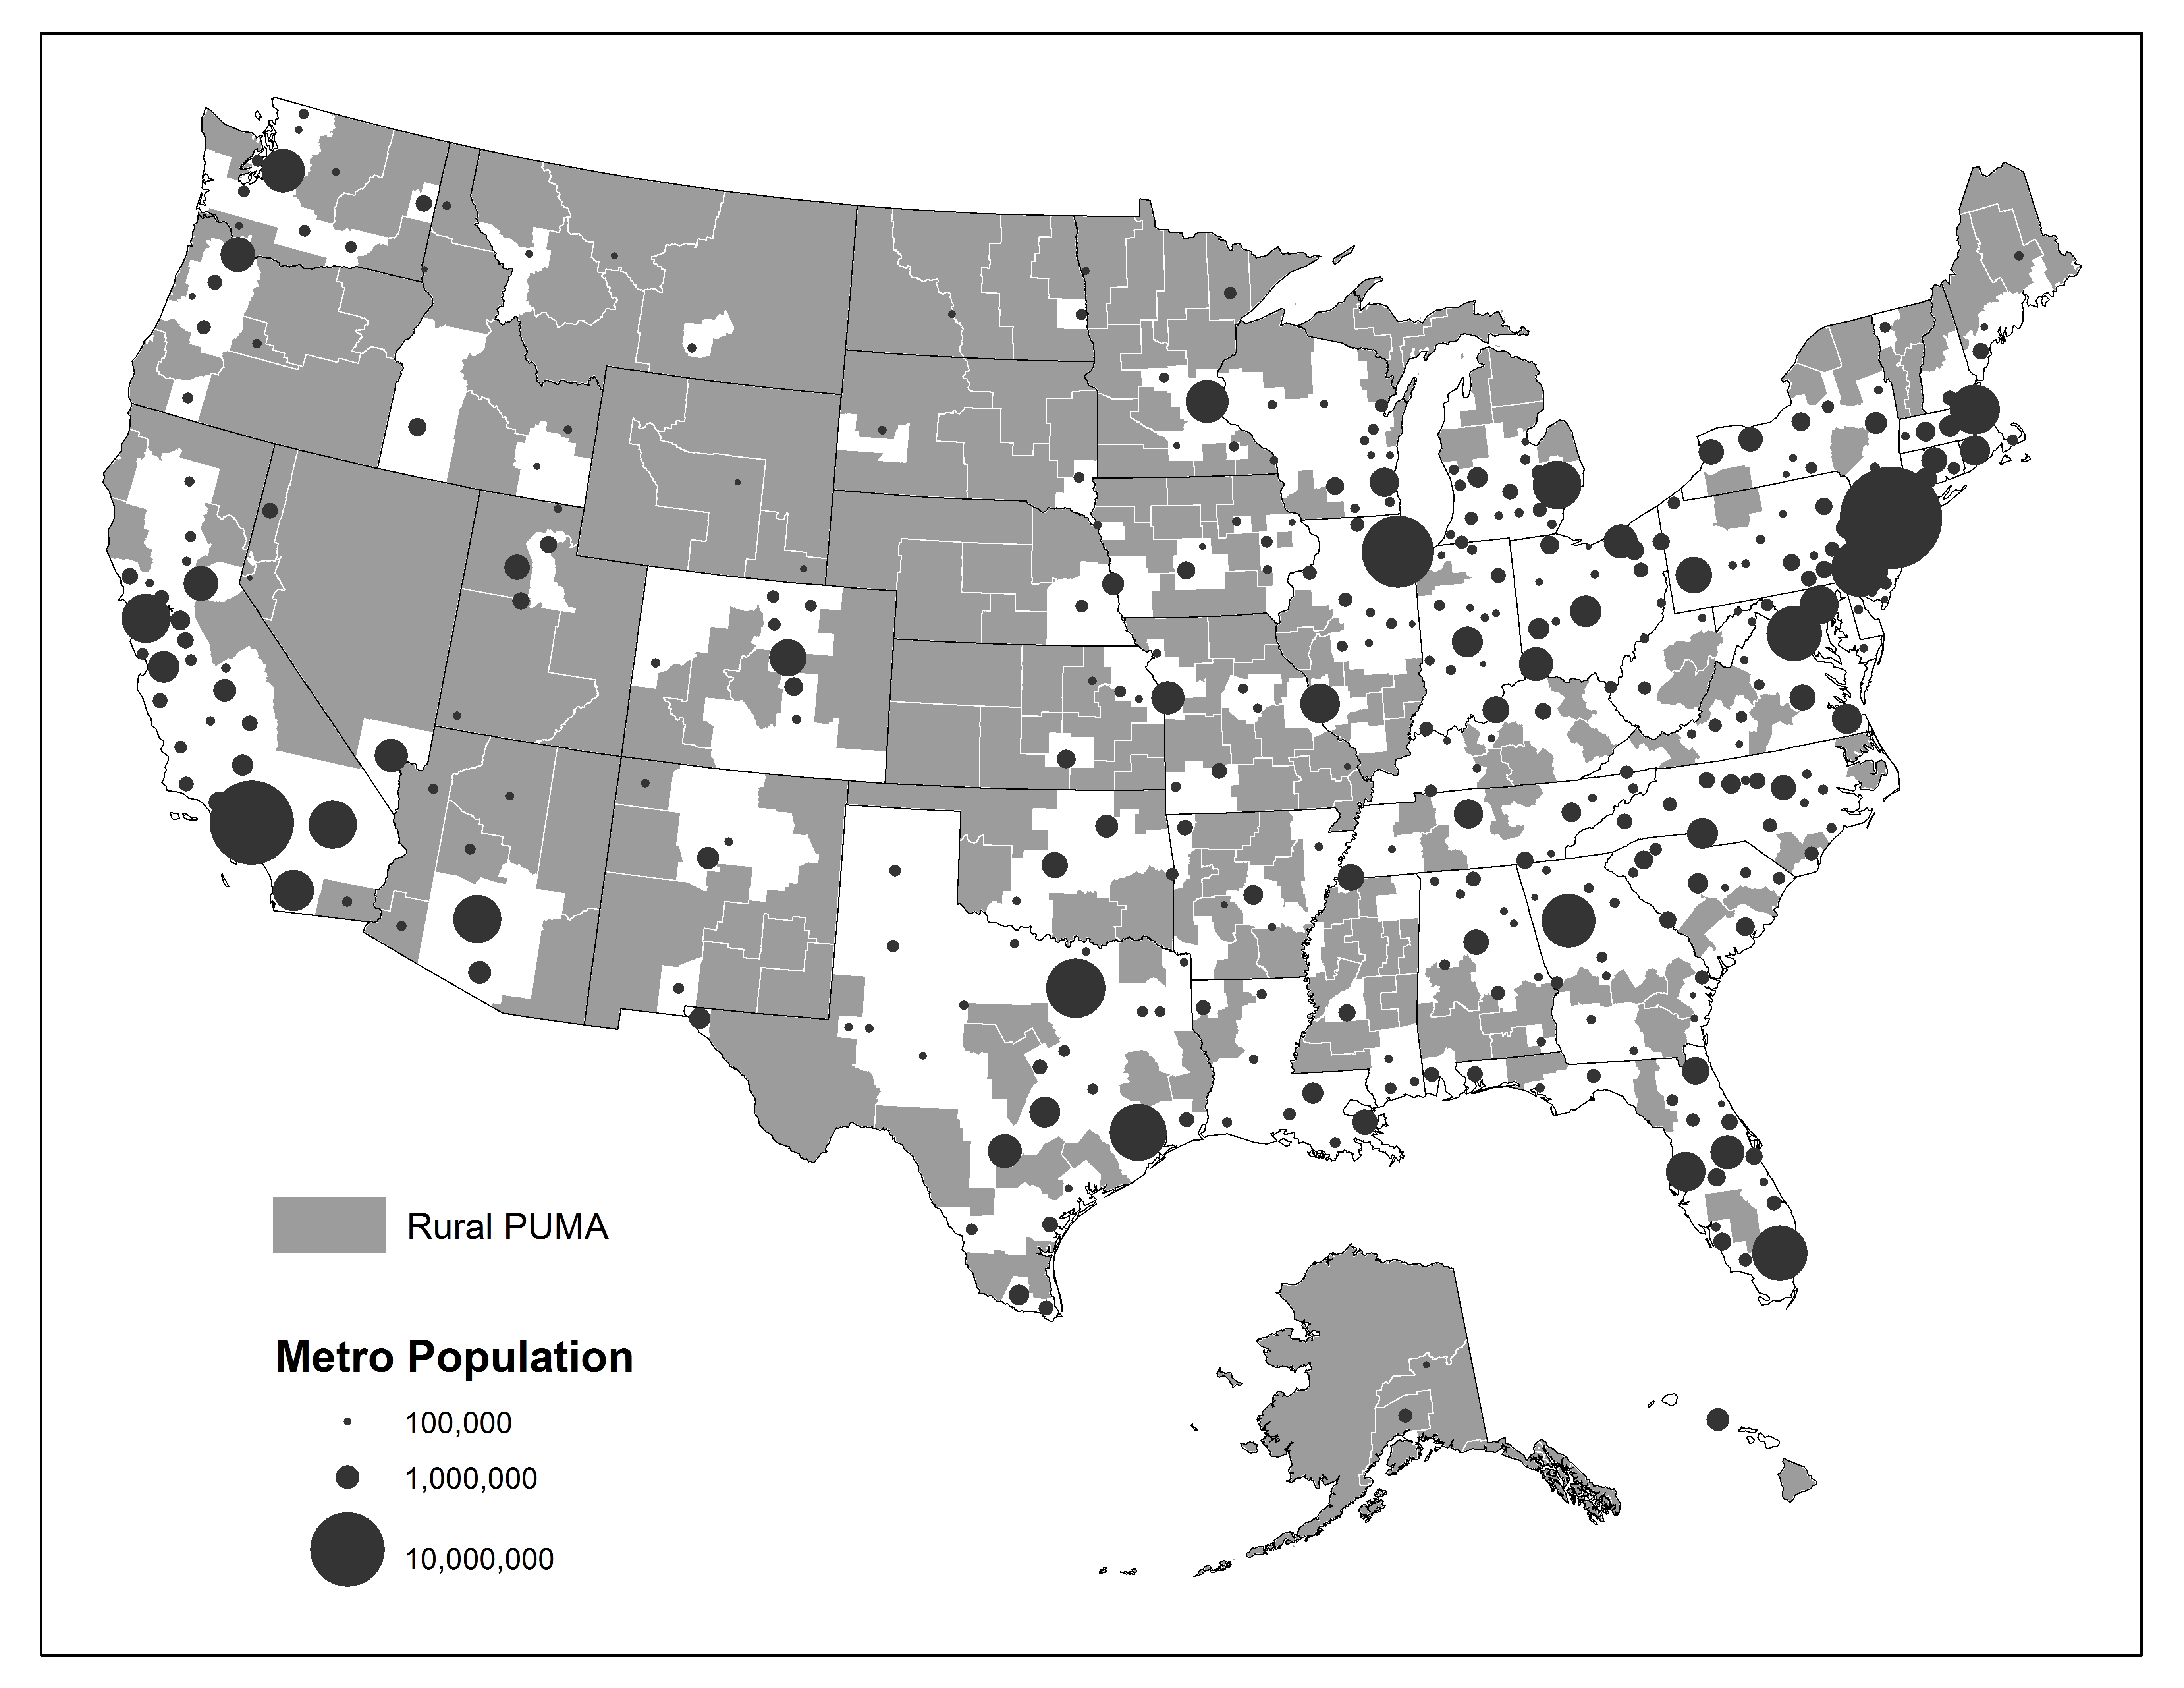
All of the U.S. PUMAs were categorized based on their distance to a Census-defined central city and population density. We define as “rural” the PUMAs with the greatest distances to a central city and the lowest population densities. In our analysis, we arrived at 204 “place-of-work” PUMAs—about 17% of the areas considered—that fall in both the bottom 25% in terms of population density and the top 25% in terms of distance from a central city. Figure 1 is a map of these rural areas, which we compare to the overall U.S. economy in the analysis that follows, as well as the locations of U.S. metropolitan areas. The map reveals large sections of rural PUMAs in the western half of the United States, with many of the most-populated metropolitan areas located east of the Mississippi River and on both coasts.
| Basic Skills | Cross-Functional Skills | ||
|---|---|---|---|
| Content | Social Skills | Technical Skills | System Skills |
| Reading Comprehension | Social Perceptiveness | Operations Analysis | Judgement and Decision Making |
| Active Listening | Coordination | Technology Design | Systems Analysis |
| Writing | Persusasion | Equipment Selection | System Evaluation |
| Speaking | Negotiation | Installation | Resource Management Skills |
| Mathematics | Instructing | Programming | Time Management |
| Science | Service Orientation | Operation Monitoring | Mgmt. of Financial Resources |
| Processes | Complex Problem Solving Skills | Operation and Control | Mgmt. of Material Resources |
| Critical Thinking | Complex Problem Solving | Equipment and Maintenance | Mgmt. of Personnel Resources |
| Active Learning | Troubleshooting | ||
| Learning Strategies | Repairing | ||
| Monitoring | Quality Control Analysis | ||
The second part of the analysis involves coming up with a skills-based profile of all occupations and regions of the United States (Feser, 2003). To do this, we started with occupational requirements in 35 specific skill areas, which are grouped in Table 1 into the broad categories of content, process, social, complex problem solving, technical, system, and resource management. We use occupation-level information from the U.S. Department of Labor’s Occupational Information Network (O*NET) on the importance and level of skill required in these 35 areas along with a cluster analysis technique that is used to join together jobs with similar skill requirements to reduce 444 narrowly-defined occupations into 11 skills-based clusters, presented in Table 2.
The eleven clusters shown in Table 2 are listed in order from highest to lowest skills requirements, based on the 35 dimensions of skill. The first cluster, which we termed “Engineers” due to the high levels of complex problem solving, system, process, and content skills that are required, includes occupations such as chemical engineers, computer programmers, and database administrators. The cluster that we labeled as “Executives,” made up of occupations such as chief executives, financial managers, and lawyers, has an overall skills profile that falls only slightly below that of Engineers, with particularly high requirements in the dimensions of social, resource management, system, and process skills. The cluster of “Laborers,” shown at the bottom of Table 2, includes occupations such as dishwashers, taxi drivers, and laundry workers, which have very low requirements in almost all of the dimensions of skill.
| Cluster | Total Occupations | % of U.S. Workforce | Representative Occupations |
|---|---|---|---|
| Engineers | 22 | 3.6 | Chemical engineer, computer programmer, database administrator |
| Executives | 24 | 8.3 | Cheif executives, financial managers, education administrators, lawyers |
| Scientists | 42 | 8.1 | Biologists, psychologists, economists, physicians and surgeons |
| Managers | 21 | 7.8 | Funeral directors, transportation managers, purchasing agents, sales managers |
| Technicians | 29 | 2.5 | Chemical technician, drafter, clinical lab technologist, explosives worker |
| Analysts | 39 | 11.5 | Budget analyst, market researcher, cost estimator, technical writer |
| Machinists | 56 | 5.2 | Aircraft mechanic, electrician, security system installer |
| Servers | 56 | 17.7 | Salesperson, dental assistant, receptionist, payroll clerk, cargo agent |
| Makers | 71 | 12.9 | Carpenter, tool and die maker, engine assembler, machine feeder |
| Assistants | 42 | 10.0 | Baggage porter, teacher assistant, counter clerk, home care aide |
| Laborers | 42 | 12.3 | Dishwasher, roofer, taxi driver, laundry worker |
The next step of our analysis involves using the clusters that we developed to come up with a skills profile for areas of the United States that we classified as rural. The figures shown in Table 3 are so-called location quotients that are measured as the cluster’s average percentage of workforce employment in the rural PUMAs divided by the share of the total U.S. workforce in the same skills-based cluster. PUMA workforce information is from the 2005-09, 5-year estimates of the American Community Survey conducted by the U.S. Census Bureau. Values greater than 1.0 indicate that the skills-based cluster is over-represented in rural areas—in other words, rural areas “specialize” in a particular skills cluster—while values less than 1.0 suggest that the cluster is under-represented in rural areas compared to the United States as a whole.
These figures reveal some striking differences between the skills profile of rural areas and the overall U.S. economy. First, rural areas tend to specialize in the skills-based clusters of Machinists and Makers, which include “hands-on” occupations in the construction trades, production and assembly, and maintenance and repair. These
clusters are characterized by relatively low skills requirements—for example, ranked 7th and 9th, respectively, out of the 11 clusters. Looking at the clusters with the highest skills requirements, we see that rural areas are under-represented in the areas of Engineers and Executives, with location quotients of 0.68 and 0.84. This means that the percentages of the rural workforce in these clusters are well below the corresponding national averages. Rural areas also tend to be under-represented in the clusters of Analysts, Scientists, and Technicians. The share of individuals in the rural workforce is similar to the national average—this means that location quotients are close to 1.0—in the skills-based clusters of Managers, Servers, Assistants, and Laborers.
From the location quotients presented in Table 3, we can gain insight about the skills profile of U.S. rural areas. First, as noted above, rural areas have relatively low employment shares, compared to the U.S. economy, in the highest skilled clusters of Engineers and Executives, and—to a lesser extent—rural areas lag behind the nation as a whole in the presence of Scientists. The highest skill cluster with a location quotient above 1.0 in rural areas is Managers, which we find to be fairly evenly spread across all types of regions. The next highest skill cluster that is over-represented in rural areas is Machinists. This cluster is characterized by very high technical skills, although it rates very low in terms of social, resource management, and process skills. Rural areas also specialize in the skills-based clusters of Makers and Laborers, which have among the lowest overall skills requirements of the 11 clusters. Taken together, these results indicate that the rural workforce has a high concentration of Machinists—possessing high technical skills—a slightly higher share of Managers than the U.S. economy as a whole, and a specialization in occupations with very low skills requirements.
| Cluster | Measure of Rural Specialization (Location Quotients) | Expected Growth Rate Nationally |
|---|---|---|
| Engineers | 0.68 | 17.7% |
| Executives | 0.84 | 10.0% |
| Scientists | 0.9 | 19.5% |
| Managers | 1.03 | 4.9% |
| Technicians | 0.92 | 12.0% |
| Analysts | 0.87 | 14.4% |
| Machinists | 1.19 | 4.7% |
| Servers | 0.96 | 12.1% |
| Makers | 1.16 | 4.7% |
| Assistants | 1 | 10.4% |
| Laborers | 1.04 | 4.1% |
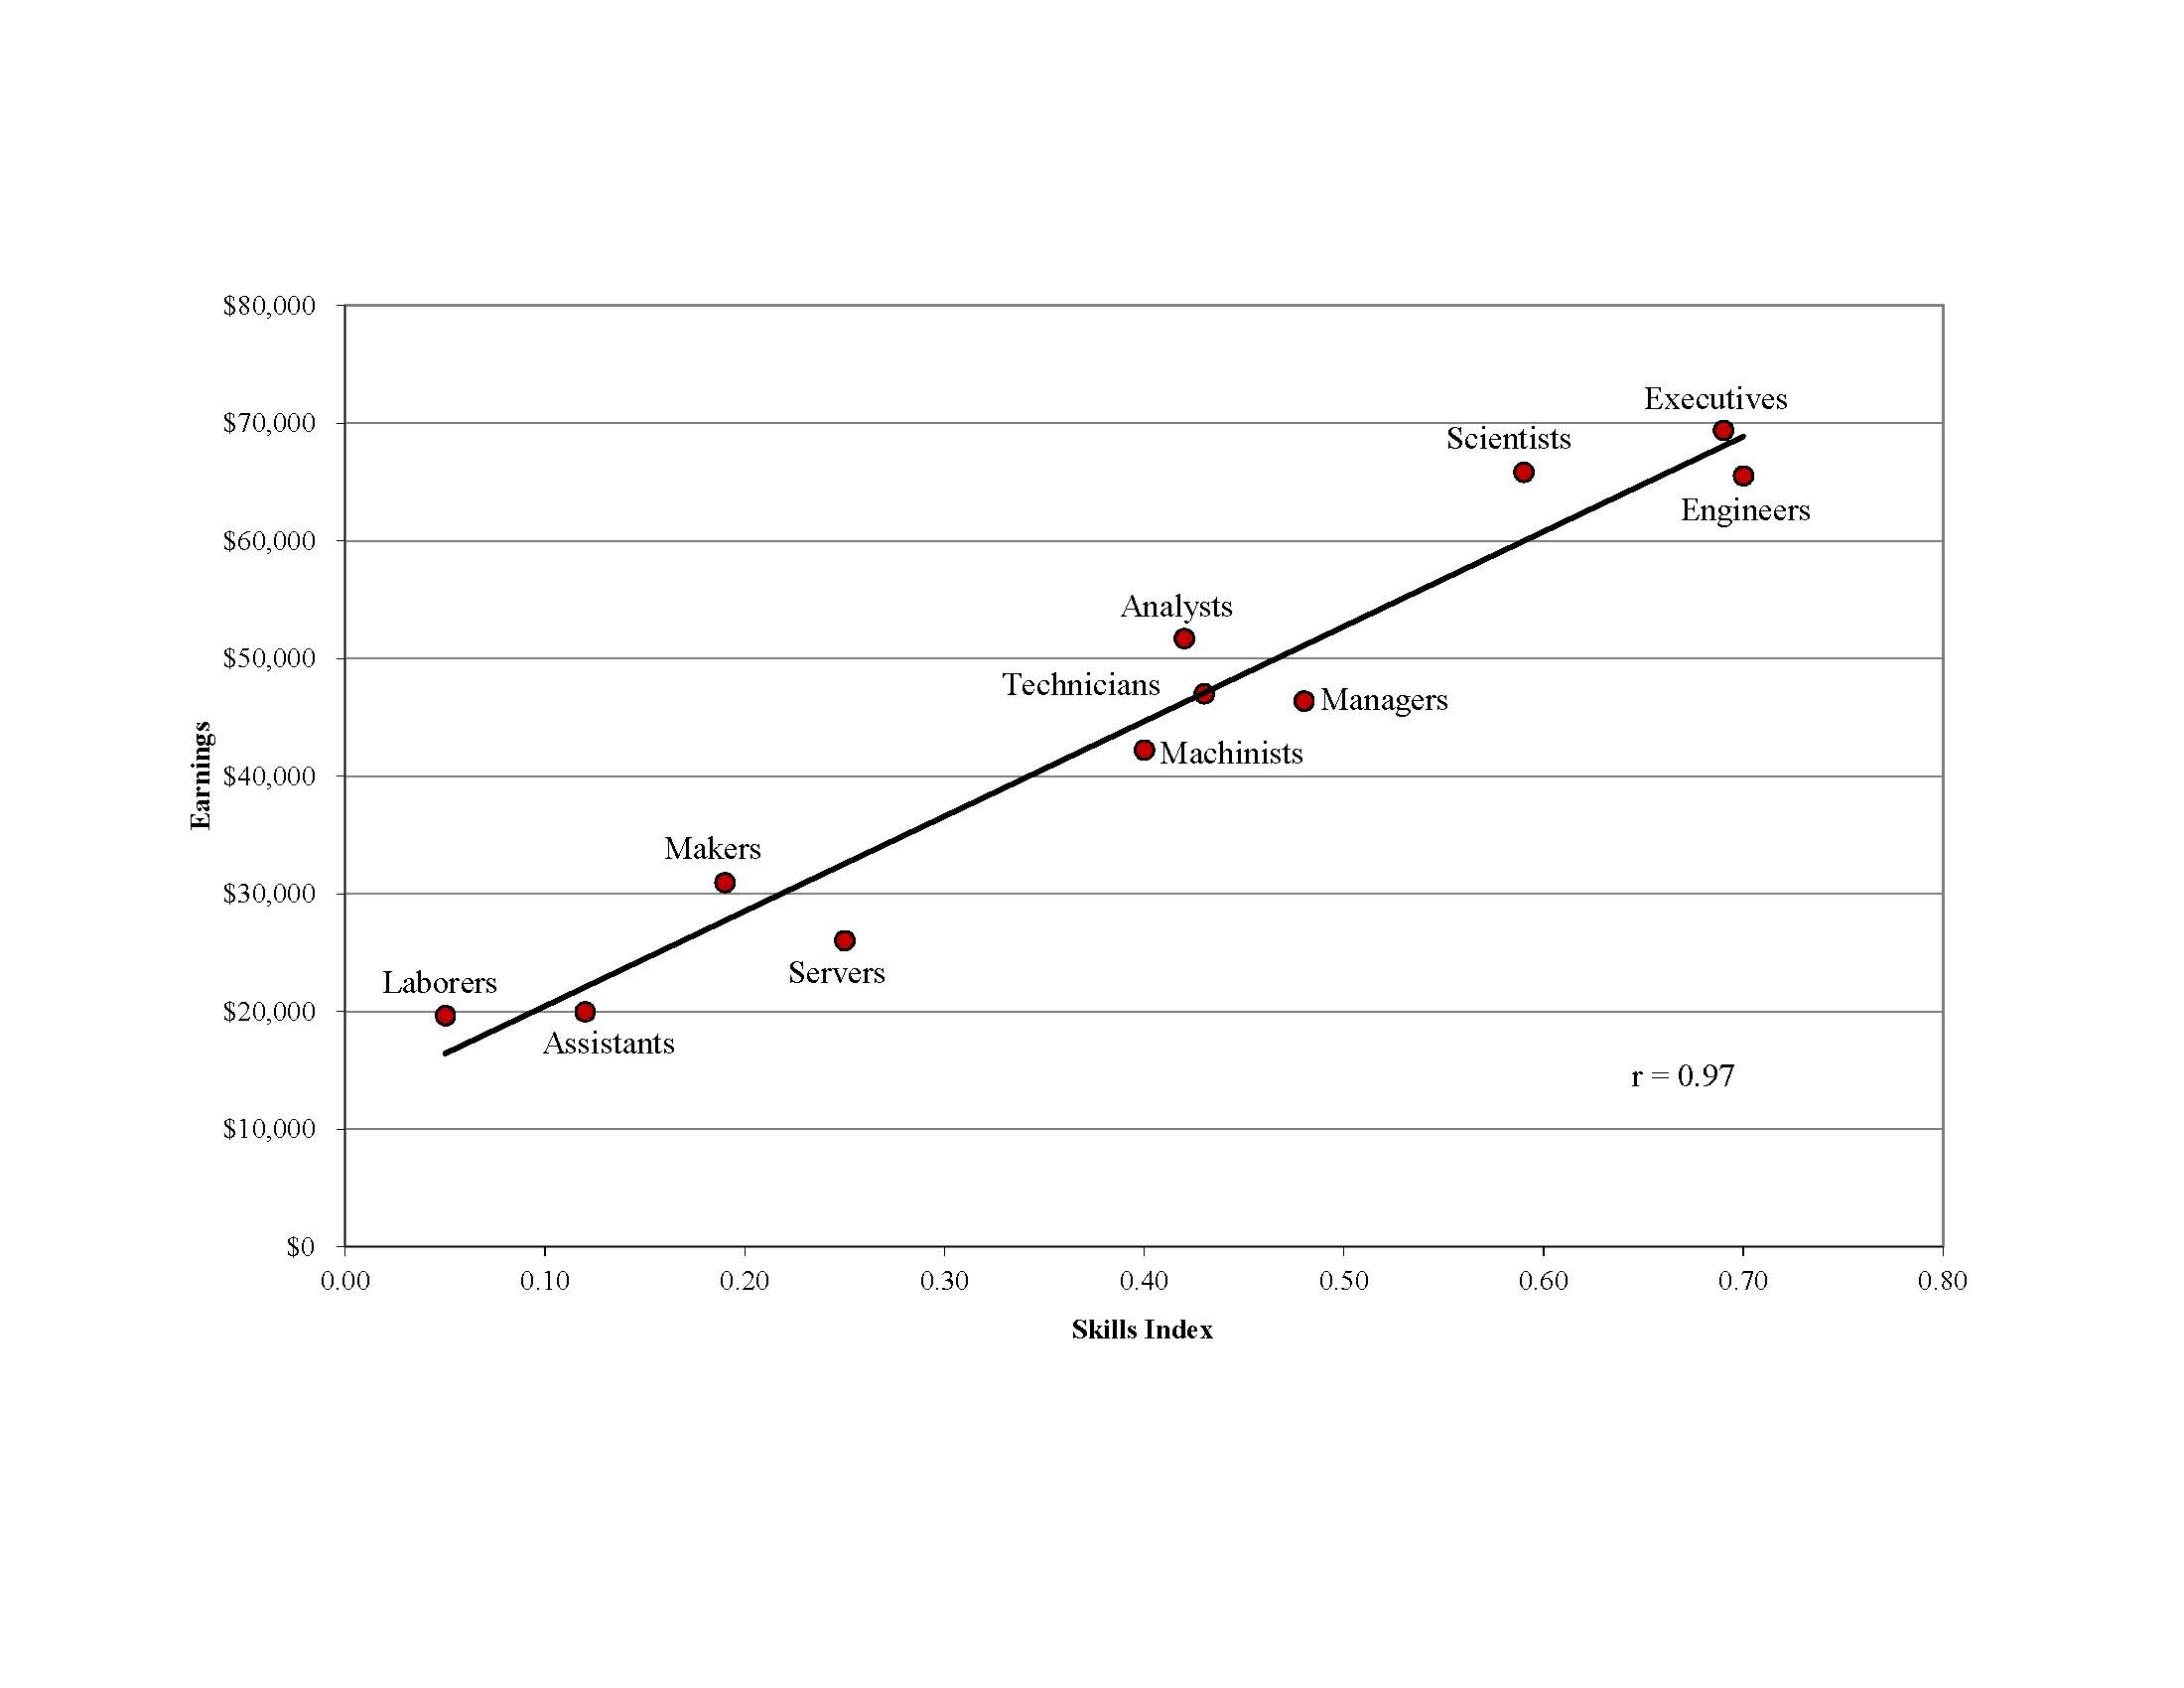
The skills profile of rural areas has important implications related to the present vitality and future growth prospects for these regions. In the present, the types of skills available in the workforce have a very strong association with earnings. Figure 2 is a scatter plot showing the relationship between average earnings in the cluster, using data from the 2005-09, 5-year U.S. Census American Community Survey, and its average skills index value that is based on the seven broad dimensions of skill shown in Table 1. The scatter plot reveals a strong correlation between skills and earnings—a finding uncovered in numerous academic studies (Florida, et al., 2012; Abel and Gabe, 2011). This means that the types of skills-based clusters that are over-represented and under-represented in rural areas explain, at least in part, the rural-urban wage gap that has persisted for years.
Looking into the future, we can see that—based on the types of occupations and corresponding skills available in the workforce—rural areas will likely experience lower employment growth rates than the overall U.S. economy. To arrive at this conclusion, we used the most current ten-year occupational employment growth projections from the U.S. Bureau of Labor Statistics and matched individual occupations to their appropriate skills-based cluster. Then, with the employment growth projections, we were able to estimate ten-year projected growth rates and net changes in employment. The skills-based clusters of Scientists and Engineers are expected to be the fastest growing occupational clusters over the ten-year period, followed by Analysts, Servers, and Technicians. The clusters with the lowest projected growth rates are Laborers, Makers, and Machinists. Rural areas specialize in all three of these skills-based clusters with the slowest expected growth rates, and they are under-represented in the occupational groups that are expected to grow the fastest.
In the cases of the skills-based clusters of Scientists, Engineers, and Analysts, which are expected to grow the fastest, the agglomeration benefits accruing to places with a high initial specialization of employment may be hard for rural areas and other places that are under-represented in these clusters to overcome. In other words, the employment growth projected to occur in the clusters of Scientists, Engineers, and Analysts will likely occur in and around places with a high initial specialization. The next tier of clusters in terms of projected employment growth may be a more realistic source of job creation in rural areas. The clusters of Servers and Assistants have rural employment shares that are more similar to the United States as a whole. These skills-based clusters are expected to experience double-digit employment growth rates over a ten year period—much higher than the expected growth of clusters that are over-represented in rural areas.
The purpose of this article was to provide a broad-brush assessment of the types of skills that are present in the rural workforce, and then to examine the prospects for rural employment change based on the projected growth of skills-based clusters nationally. Our analysis shows that rural areas of the United States face some serious challenges in the new economy considering their tendency to specialize in low-skilled jobs, and these occupations are expected to experience slow employment growth in the future. The highest-skilled occupations, which are also those expected to grow the fastest nationally, are vastly under-represented in rural areas. The skills-based clusters with a combination of solid—but not spectacular—growth prospects and a reasonably strong initial presence in rural areas are the clusters of medium- and low-skilled jobs such as Servers and Assistants. These occupational groups, which tend to be available in almost equal proportions just about everywhere, might be a source of future employment growth in rural areas.
Nonetheless, it is important to recognize that our analysis provides a “view from 30,000 feet” of the skills profile and employment growth prospects of rural areas. Rural areas are diverse and, just as it would be inaccurate to claim that all cities will thrive in the new economy, it would be equally misleading to assert that all rural areas will struggle. Some rural areas will be able to prosper in the future despite an under-representation of new economy occupations and industries, while others will benefit from an initial specialization of high-skilled workers. Although our study identifies some real challenges facing rural policymakers in promoting economic development, the analysis does not point to a one-size-fits-all policy that rural areas can use to increase workforce skills. The types of policies most likely to bear fruit will differ across rural areas, depending on their location, knowledge-based assets—for example, presence of a university or community college—and workforce profile. Our study illustrates some interesting high-level trends in the location of high- and low-skilled occupations, but this type of analysis should be used as a complement to, not a substitute for, more detailed regional-level research that can illustrate the keys to growth for individual communities.
Abel, J. R., and Gabe, T. (2011). Human capital and economic activity in urban America. Regional Studies, 45(8), 1079-1090.
Abel, J. R., Gabe, T., and Stolarick, K. (2012). Workforce skills across the urban-rural hierarchy. Federal Reserve Bank of New York, Staff Report No. 552, February 2012.
Feser, E. (2003). What regions do rather than make: A Proposed Set of Knowledge-based Occupation Clusters. Urban Studies, 40(10), 1937-1958.
Florida, R. (2002). The Rise of the Creative Class, New York: Basic Books.
Florida, R., Mellander, C., Stolarick, K., and Ross, A. (2012). Cities, skills and wages. Journal of Economic Geography, 12(2), 355-377.
Gasper, J., and Glaeser, E. 1(998). Information technology and the future of cities. Journal of Urban Economics, 43(1), 136-156.
Storper, M., and Venables A. (2004). Buzz: face-to-face contact and the urban economy. Journal of Economic Geography, 4(4), 351-370.

