Retaliatory tariffs imposed by trading partners have had major impacts on U.S. commodity markets. As detailed in other articles in this theme issue, these tariffs have reduced U.S. exports and resulted in lower domestic commodity prices. These changes have important implications for farmers, taxpayers, and others with a stake in U.S. agriculture.
We use estimates of the commodity market impacts of retaliatory tariffs to estimate implications for farm income, government farm program outlays, and other indicators. The results highlight the importance of considering effects that extend across markets, such as how a change in soybean exports and prices may affect producers of corn, chickens, and other commodities. They also provide a reminder that the current suite of farm policies includes a mix of countercyclical and procyclical programs.
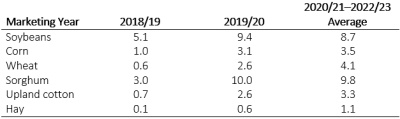
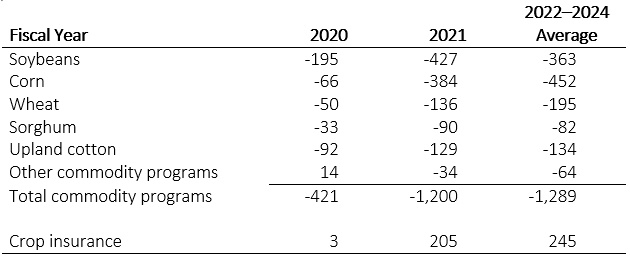
Note: The baseline continues tariffs that were in place in February 2019.
The scenario assumes that retaliatory tariffs were lifted on March 1, 2019.
The point of comparison for the analysis is a set of baseline projections for U.S. agricultural markets (FAPRI, 2019) that assumes a continuation of policies in place in February 2019. Those policies include the retaliatory tariffs imposed by China and other countries in response to U.S. tariffs on steel, aluminum, and other products. The baseline includes projections of production, prices, and use of grains, oilseeds, and other crops; biofuels; livestock; dairy; and poultry. At the sector level, the baseline includes estimates of farm income, the farm balance sheet, government program costs and consumer food prices and expenditures.
The alternative scenario assumes that retaliatory tariffs were lifted on March 1, 2019, midway through the 2018/2019 marketing year for U.S. soybeans, corn, and sorghum. To estimate the market impacts, a combination of modeling approaches was used. We used a bilateral trade model for the soybean sector to estimate the impact on U.S. trade and prices of the elimination of China’s 25% retaliatory tariff on U.S. soybeans (Westhoff, Davids, and Soon, 2019). The soybean sector trade equations in the FAPRI-MU baseline model (Meyers et al., 2010) were then adjusted to reproduce the soybean price impacts estimated by the bilateral trade model.
For wheat, sorghum, cotton, corn, pork, and dairy products, we also made adjustments to trade equations. The magnitude of the adjustments was intended to reflect shifts in demand for U.S. exports that were broadly consistent with those used in USDA’s calculations of 2018 Market Facilitation Program (MFP) payment rates per unit (USDA, 2018). The MFP was designed to assist farmers adversely impacted by market disruptions, and payments made under the 2018 MFP were based on harvested production of the affected commodities. Note that this analysis was completed before the second round of MFP payments was announced in May 2019.
The USDA’s MFP rate calculations were based on estimates of the reduction in U.S. bilateral exports to countries imposing retaliatory tariffs, not on expected price impacts. As such, the estimates did not incorporate the net effect of the trade disruptions on U.S. exports to all markets as trading patterns were rearranged. China’s soybean tariff, for example, has sharply reduced U.S. soybean exports to China, but some of this lost trade has been diverted as the U.S. backfills in other markets that previously imported from Brazil and other suppliers that are now selling more to China. This analysis takes trade diversion into account, so the marginal impact of tariff elimination of a particular commodity on U.S. prices for that commodity is less than the USDA’s gross trade damage estimates.
Crop price impacts are reported in Table 1. For any given commodity, the reported change in prices reflects both the direct and indirect impacts of removing tariffs. In the case of corn, for example, the direct effect of tariff removal is likely small, as China remains unlikely to import much U.S. corn, even if retaliatory tariffs were eliminated, given other long-standing trade barriers. However, in this analysis, corn prices exceed baseline levels by about 3% in the 2019/2020 marketing year, primarily because higher soybean and sorghum prices would cause some U.S. producers to shift away from corn production and some livestock feeders to use more corn and less sorghum.
Note: aRice, barley, oats, sunflowers, peanuts, sugar
cane, and sugar beets.
The proportional impacts on soybean and sorghum prices are larger than for other crops, consistent with China’s importance in U.S. trade for those commodities. For cotton and wheat, the price changes can be attributed both to the direct effects of lower tariffs for those commodities and cross-price effects. Prices of hay and other crops increase primarily due to substitution effects.
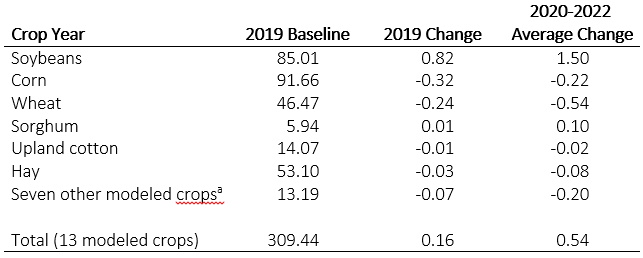
Because the assumed tariff removal occurs midway through the 2018/2019 marketing year, effects on annual average prices are muted. Likewise, many farmers had already made 2019 acreage decisions by that time, so impacts on 2019 planted area (Table 2) are also fairly small. Full effects of the tariff removal are felt in 2019/2020 and subsequent years. Given the changes in relative prices, soybean and sorghum acreage expand, while area devoted to other crops declines relative to the baseline. Total acreage for 13 modeled crops increases only marginally, as the total amount of land used for crop production is not very sensitive to output price levels.
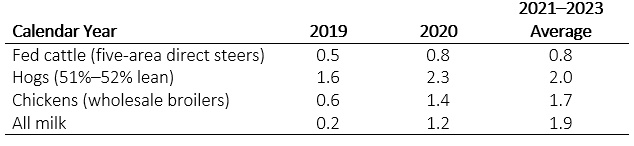
Hog and milk prices increase because of shifts in export demand when retaliatory tariffs are eliminated (Table 3). In addition, higher prices for grain, soybean meal, and hay increase livestock production costs. All else equal, those higher costs tend to reduce production, contributing to higher prices. Finally, as pork prices increase, the price of competing meats also increases as consumers adjust their consumption levels.
Table 4. Impact of Eliminating Retaliatory Tariffs on
U.S. Farm Income ($billions, change from baseline)
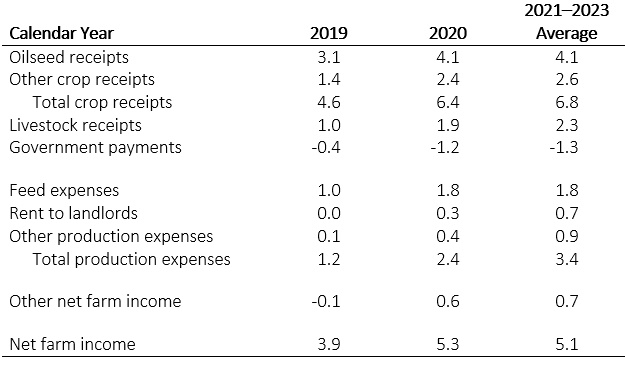
Note: Other net farm income includes crop insurance indemnity payments,
the value of inventory changes, and other adjustments to farm income.
Eliminating retaliatory tariffs increases estimated net farm income by about $4 billion in 2019 and about $5 billion in subsequent years, relative to the current-policy baseline (Table 4). Higher prices and production of soybeans account for most of the increase in the value of crop production, with oilseed receipts increasing by about $3 billion in 2019 and $4 billion in 2020. For some other crops, higher prices are partially offset by slightly lower production. Total crop receipts increase by more than $6 billion above baseline levels in 2020.
On the livestock side, the effect of higher prices dominates, so total receipts from sales of dairy, meat, and poultry products exceed baseline levels by about $2 billion in 2020. Note, however, that the estimated increase in feed costs is almost as large as the increase in livestock receipts, suggesting little net impact on profitability for the livestock sector as a whole.
Increased returns to crop production drive an increase in land rental rates. Higher rents increase costs to the many operators who lease part of the land they operate, but they also reflect a benefit to landowners. Other costs also increase slightly because of shifts in production and profitability. The increase in other costs may be understated, as the model holds the prices of some inputs fixed in the scenario. Overall production expenses exceed baseline levels by more than $1 billion in 2019, $2 billion in 2020, and $3 billion in later years, with higher costs for both crop and livestock producers.
In addition to higher production expenses, the impact of higher commodity prices on farm income is moderated by a reduction in government payments, as described below. “Other net farm income” includes a variety of components, including changes in the value of inventories and crop insurance indemnity payments. It increases slightly in 2020 and later years, in part because of an uptick in crop insurance indemnity payments resulting from higher commodity prices.
These estimates of farm income impacts are sensitive to the estimates of commodity market impacts, which are quite uncertain. It should also be noted that the estimates are limited to a subset of commodities; there may well be important implications for other commodities not examined here.
Table 5. Impact of Eliminating Retaliatory Tariffs on
U.S. Government Outlays ($millions, change from baseline)
Note: Payments under the Agriculture Risk Coverage (ARC) and
Price Loss Coverage (PLC) programs apply to base acres of listed
crops, not to production of those crops. ARC/PLC payments are
made beginning October 1 of the year after marketing year price and
production data are available, which places them in the following
fiscal year (e.g. payments associated with marketing year 2018/2019
are paid in fiscal year 2020, which runs October 1, 2019 to September
30, 2020). Payments for other programs may affect outlays in more
than one fiscal year.
A variety of government programs make payments to farmers when they are faced with adverse conditions. The Price Loss Coverage (PLC) program makes payments on program base acreage when marketing year average prices fall below fixed reference prices. The Agriculture Risk Coverage (ARC) program makes payments on base acreage when county-level revenues per acre for a given crop fall below a trigger tied to past prices and yields. The marketing loan program provides benefits when an indicator of local prices falls below a loan rate. Crop insurance programs make indemnity payments when yields or revenues fall below an insured level.
The countercyclical design components of these programs generally mean that program outlays will fall when there is an unanticipated increase in prices. As shown in Table 5, estimated commodity program outlays are reduced by over $400 million in fiscal year 2020 and by $1.2 billion in fiscal year 2021. Given the timing of ARC and PLC payments, those are costs primarily associated with the 2018 and 2019 crop years, respectively.
In fiscal year 2020, the drop in ARC/PLC payments on soybean base acres accounts for almost half of the overall change in commodity program spending, but in later years, the change in ARC/PLC payments on corn base acres is comparable or even larger. Given the much larger estimated change in soybean prices than in corn prices, this result might appear odd. Two factors can explain this result. First, there are more corn than soybean base acres and corn program yields are higher than soybean program yields per acre. Second, average baseline corn prices are below or near the reference price, while average baseline soybean prices are generally above the reference price.
If we were looking at the question considering only a single point estimate of future outcomes, there would be zero PLC payments on soybean base in both the baseline and in the scenario, as both the baseline and scenario have prices above the reference price. However, given the uncertainty of agricultural markets, the model considers a distribution of possible prices. In the case of corn, much of that distribution is below the reference price, so increasing corn prices by even a modest amount results in significant PLC program savings. In the case of soybeans, a smaller portion of that distribution is below the reference price, so the expected value of PLC payments on soybean base is relatively small in the baseline. With a higher average price, the portion of the distribution generating payments is even smaller, so there is some modest reduction in expected PLC payments relative to the baseline. A similar logic applies to ARC payments and marketing loan benefits.
While the commodity program results are consistent with the notion that the basic programs are countercyclical with respect to prices, Table 5 indicates that crop insurance outlays are largely unchanged in fiscal year 2020 and actually exceed baseline levels in fiscal year 2021 and later years. While an unexpected price increase can reduce crop insurance outlays in the short run, higher prices increase the value of insured crops in the longer run. Since premium subsidies are largely proportional to the value of crops insured, those subsidies increase when commodity prices and crop values increase.
These estimates of government outlays do not include any payments from a trade mitigation program, since both the baseline and the scenario assume no such program for 2019 and later years. In any case, outlays under such a program presumably would not contribute to variations in government outlays, since they would not be affected by changes in prices and production resulting from the lifting of tariffs. In fact, assuming the existence of trade mitigation payments in the baseline would have presented some difficulties with the scenario, since had tariffs been lifted in March 2019, presumably trade mitigation would not have been implemented. The MFP payments for both 2018 and 2019 exceed our estimated impacts of retaliatory tariffs on farm income. However, MFP was not designed to offset the farm income impacts of those tariffs. As discussed earlier, MFP payment rates do not consider the impact of the tariffs on sales to other markets, nor do they consider cross-commodity effects.
Figure 1. U.S. and Brazilian Soybean Prices ($/metric ton)

Source: U.S. Department of Agriculture (2019a, September issue);
Louisiana Gulf price from U.S. Department of Agriculture (2019b).
The estimates reported here utilize a baseline prepared in February 2019, based on conditions at that time. Much has happened in recent months, some of which might result in different estimates of the impact of tariff elimination if the analysis were updated to use a baseline reflecting the market situation in the fall of 2019.
For example, the February baseline assumed the impacts of African Swine Fever (ASF) on pork production would be fairly modest. More recent information suggests that ASF may have a larger negative impact on pork production in China. By the end of September 2019, the year-over-year decline in China’s pig inventory for 2019 had reached 41% (Patton, 2019) and is expected to increase further toward the end of the year. This means there are fewer hogs to feed in the country and in the world as a whole. The result is a reduction in China’s demand for soybeans for soybean meal production. This implies lower soybean imports than reflected in the analysis reported here.
Reduced total demand in China for soybean imports will result in lower prices for soybeans in all markets. It also becomes easier for South America to satisfy almost all of China’s import needs when tariffs are in place. With a lower level of total imports by China, South America can meet a very high proportion of China’s import requirements and still maintain some sales to third-country markets. Given all the parameters of the model, this would imply a smaller gap between prices in the United States and in other countries when the retaliatory tariffs are in place. In turn, that implies that lifting the tariff would have had a smaller positive impact on U.S. soybean market prices than suggested here.
Some evidence for this comes from observed prices of U.S. and Brazilian soybeans over the past year. There was a wide gap between U.S. and Brazilian export prices in the fall of 2018, very little difference between prices in the two countries in early 2019, and only a modest gap in August and September 2019 (Figure 1). In addition to ASF, other factors may have contributed to this observed behavior. Rumors of a possible trade deal may have made market participants unwilling to pay a large premium for South American soybeans. Also, reports suggest that China often waived tariffs on the limited imports of U.S. soybeans that did occur (Bloomberg News, 2019). Thus, contrary to the assumptions of the model used here, the marginal cost of U.S. soybeans in China’s market may have been less than the U.S. price plus the tariff.
Retaliatory tariffs on U.S. farm products have large impacts on a wide range of stakeholders. Our estimates indicate that eliminating those tariffs would result in higher farm commodity prices, shifts in production, increased net farm income, and lower government payments. The magnitude of these various impacts is uncertain, and the estimates reported here are based on a long series of assumptions. While any given estimate should be treated with caution, the analysis does provide some indication of how various factors interact. Results confirm the notion that indirect effects should not be ignored. Changes in China’s imports of U.S. soybeans eventually impact the price of corn, the production of livestock, and broader spending on income support programs. Analysis focused on a single commodity can miss some critical parts of the story.
Bloomberg News. 2019. “China Buys 1 Million Tons of U.S. Soy After Tariff Waivers.” Available online: https://www.bloomberg.com/news/articles/2019-10-01/china-buys-1-million-tons-of-u-s-soy-as-tariff-waivers-given.
Food and Agricultural Policy Research Institute (FAPRI). 2019. U.S. Baseline Outlook: Projections for Agricultural and Biofuel Markets. Columbia, MO: University of Missouri, Food and Agricultural Policy Research Institute, FAPRI-MU Report 01-19.
Meyers, W., P. Westhoff, J. Fabiosa, and D. Hayes. 2010. “The FAPRI Global Modeling System and Outlook Process.” Journal of International Agricultural Trade and Development 6(1): 1–19.
Patton, D. 2019. “China’s Record Pork Prices to Rise Faster, Further: Analysts.” U.S. News and World Report. Available online: https://money.usnews.com/investing/news/articles/2019-10-15/chinas-record-pork-prices-to-rise-faster-further-analysts.
U.S. Department of Agriculture. 2018. Trade Damage Estimation for the Market Facilitation Program and Food Purchase Distribution Program. Washington, DC: U.S. Department of Agriculture, Office of the Chief Economist. Available online: https://www.usda.gov/oce/trade/USDA_Trade_Methodology_Report.pdf.
U.S. Department of Agriculture. 2019a. Oilseeds: World Markets and Trade. Washington, DC: U.S. Department of Agriculture, Foreign Agricultural Service. Available online: https://www.fas.usda.gov/data/oilseeds-world-markets-and-trade [Accessed November 2019].
U.S. Department of Agriculture. 2019b. State Grain Reports. Washington, DC: U.S. Department of Agriculture, Agricultural Marketing Service. Available online: https://www.ams.usda.gov/market-news/state-grain-reports [Accessed November 2019].
U.S. Department of Agriculture. 2019c. USDA Announces Support for Farmers Impacted by Unjustified Retaliation and Trade Disruption [press release]. Washington, DC: U.S. Department of Agriculture. Available online: https://www.usda.gov/media/press-releases/2019/05/23/usda-announces-support-farmers-impacted-unjustified-retaliation-and.
Westhoff, P., T. Davids, and B. M. Soon. 2019. “A Hybrid Model Approach to Estimating Impacts of China’s Tariff on U.S. Soybeans.” Paper presented at the annual meeting of the Agricultural and Applied Economics Association, Atlanta, GA, July 21–23.

