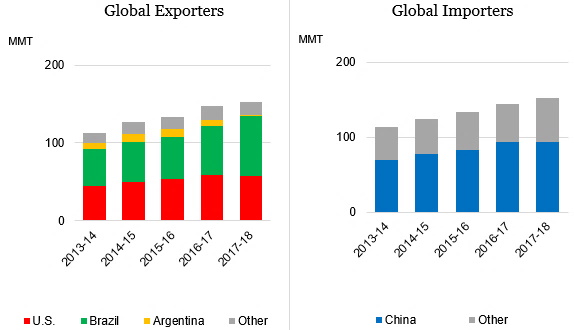
Note: MMT denotes million metric tons. U.S. marketing year for soybeans
begins September 1.
Source: U.S. Department of Agriculture (2019d).
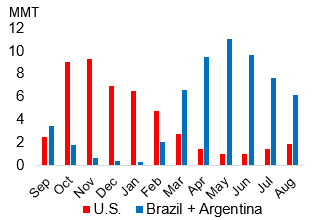
Note: MMT denotes million metric tons.
Source: U.S. Census and Secretary of Foreign Trade, Brazil (SECEX), 2019.

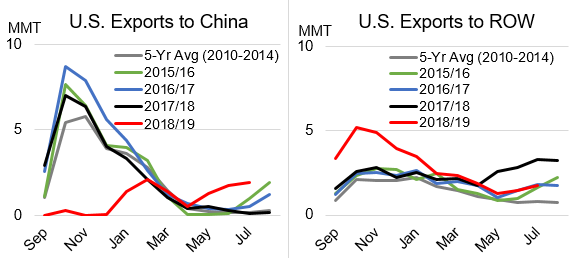
Source: U.S. Department of Agriculture (2019g).

Source: International Grains Council (2019).
Source: U.S. Department of Agriculture (2019b).
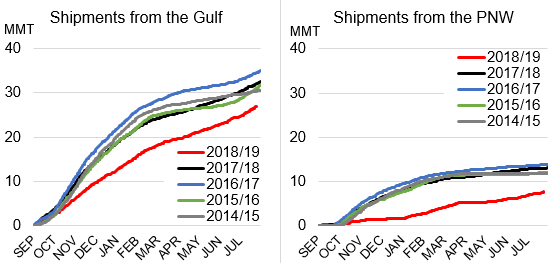
Source: U.S. Department of Agriculture (2019a).

Note: N. + S. Dakota denotes North and South Dakota, respectively.
Source: U.S. Department of Agriculture (2019c).
Source: Global Trade Atlas (2019).

Note: Midpoint of high and low values for North and South-Central Illinois.
Source: U.S. Department of Agriculture (2019 c,e,f).
Rising U.S.–China trade tensions in 2018 resulted in the application of import duties by China on U.S. soybeans. In addition to influencing 2019 U.S. planting decisions, these import duties led to sharply lower U.S. soybean exports and significant changes in global soybean trade patterns and stock holding. Among the major bulk commodities, soybeans are one of the most concentrated segments of global agricultural trade, with three major exporters—Brazil, the United States, and Argentina—and one major importer, China (Figure 1).
China’s import demand grew over 11% annually starting in 2000, rising from 25% of global trade in the 2000/2001 marketing year (October–September) to 65% in 2016/2017. This demand growth was complemented by rapid production expansion in the United States, Brazil, and Argentina and rapid export expansion, primarily in the United States and Brazil. By 2016/2017, China’s soybean imports from the United States accounted for 31% of U.S. soybean production, up from 5% in 2000.
Chinese imports of U.S. and South American soybeans are unique in that the bulk of the South American harvest occurs during February–April, while harvest in the United States is September–November. As seen in the last 10 years, prior to the U.S.–China trade tension, major exporters typically ship in six-month periods during and after harvest (Figure 2). The United States ships three-quarters of its soybean exports between September and February while South America ships over three-quarters of its soybean exports from March through August. China is dependent on each hemisphere during those periods to provide a constant supply of soybeans throughout the year.
Prior to major U.S.–China trade tensions, U.S. soybean planting decisions in the spring of 2018 were influenced by a drought in Argentina that caused the smallest Argentine crop since 2009 and supported U.S. prices. The soybean-to-corn price ratio, an indicator of the incentive to plant soybeans or corn, leaned toward planting soybeans in April and May 2018. The Central Illinois new crop soybean-to-corn price ratio was nearly 2.7, compared to the prior five-year average of 2.5. With relatively high prices, soybean planting in 2018 was the second highest on record, with major implications later in the year when U.S.–China trade tensions escalated.
By May 2018, the United States had imposed Section 232 steel and aluminum duties on Chinese imports; China retaliated with tariffs on $3 billion worth of U.S. goods. Continued U.S.–China talks failed to come to a resolution, and U.S. announcements of additional tariffs were countered with talks of Chinese tariffs on U.S. soybeans. In anticipation of a tariff, U.S. soybean prices weakened in early June (Figure 3). Further, the weather in the United States was favorable, enhancing yield prospects. It is difficult to separate the relative impact of above-average yield prospects and the impending tariff on the initial $2 price drop from June to July 2018. Although the trade dispute likely accounted for part of the price decline, expectations of a larger crop also contributed. For example, in a similar year, such as 2009, when yield prospects improved throughout the season, prices in Central Illinois fell 14% (−$1.69/bushel) from June 1 to July 15. Prices during this same period in 2018 fell 20% (−$2.02/bushel). Both the Chinese demand uncertainty and prospects of a larger crop likely played a role in the 2018 price decline.
On July 6, 2018, China implemented an additional 25% tariff on U.S. soybeans. In anticipation of the tariffs, U.S. prices fell steeply in June and continued to fall throughout the summer as South American and U.S. port prices diverged (Figure 4). From July through December 2018, South America became nearly the sole supplier of soybeans to the Chinese market, accounting for 92% of total imports over the period. Although U.S. soybeans became price competitive (including the 25% tariff) in September and October, China refrained from purchasing from the United States. Moreover, ample Brazilian supplies from a record 2018 crop partially explain the lack of U.S. exports to China. Even companies such as Cofco (China Oil and Food Corporation) and Sinograin (China Grain Reserves Group Ltd), which could reportedly import without paying the import duty, did not import U.S. soybeans despite as much as a $90/ton price advantage.
As U.S. prices declined, both in absolute terms and significantly against competing supplies, the U.S. share expanded to markets outside China (e.g., rest of world (ROW) markets). The United States shipped record amounts during the second half (March–August 2018) of the 2017/2018 marketing year (black line), with more shipments specifically to the European Union, Egypt, Pakistan, Taiwan, Vietnam, and Mexico (Figure 5). However, the growth in shipments to the ROW was not enough to offset the much lower level of exports to China, leading to a significant drop in overall U.S. soybean exports to a five-year low in the 2018/2019 marketing year. Given the relatively small markets in ROW, maintaining record monthly volumes in the 2018/2019 marketing year was unlikely without the Chinese market. The tariff implications were particularly important given that typically almost half of U.S. production is exported (49% from 2013/2018), with most of the shipments occurring soon after harvest. In the fall of 2018, the United States was about to harvest a record crop and the tariff-related shift in market dynamics would affect export patterns and stock holding in the short-term, while in the longer term the tariff would also affect producers’ planting decisions.
In the short term, lower U.S. exports to China led to higher U.S. stocks in most states, particularly in the Northern Plains states that exported mainly to China out of ports in the Pacific Northwest (PNW). Shipments from the PNW, supplied by states like North and South Dakota, had grown over the years as the ports were logistically close to China’s market. As PNW export demand declined in the absence of the Chinese market, prices in these states weakened compared to other producing states that export to other destinations through gulf ports (Figure 6).
As seen in Figure 7, lower U.S. exports in the fall of 2018 led to record U.S. March 1, 2019 soybean stocks as reported by the National Agricultural Statistics Service (USDA, 2019c). Stocks were relatively higher both on farm and in states that supplied the PNW for shipments to China. As a percentage of the 2018 crop, the year-over-year March 1 stock increase was the most pronounced in South Dakota, Michigan, North Dakota, and Illinois. Higher stocks in these areas weighed on prices. The basis levels, which reflect the relationship between cash and futures prices, were weaker in these areas compared to other states (see Adjemian et al. in this Choices theme). The high stocks also put downward pressure on 2019 soybean planting intentions (USDA, 2019e).
Increased sales to Argentina in 2018/19 helped to unwind some of these stocks. Argentina, the largest global soybean meal and oil exporter, lacked soybean supplies for crushing due to the 2018 drought, and the United States filled this demand. The United States shipped record amounts of soybeans totaling 2.2 million metric tons (mmt) to Argentina from June 2018 to February 2019. The incentive for Argentine crushers to import U.S. soybeans was to not only fill the deficit in supplies but also to increase crush margins as U.S. soybean prices were lower than domestic Argentine prices. U.S. soybean crush margins were also favorable, with rising demand and prices for U.S. soybean meal. U.S. soybean crush expanded significantly over the prior year starting in February 2018 and there were record soybean meal exports from April 2018 to January 2019, totaling 11.0 mmt.
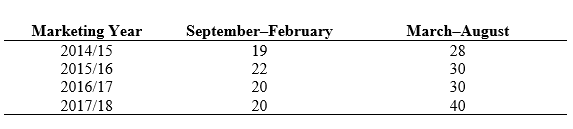
Without the Chinese market, U.S. soybean exporters relied on ROW demand, which is more heavily weighted to the second half of the U.S. marketing year during March through August (Table 1), as U.S. stocks from the fall harvest compete with the start of the South American harvest. Moreover, the bulk of importers are in the Northern Hemisphere where domestically produced supplies are lower in the second half of the marketing year, requiring imports to fill the gap.
The United States shifted its soybean storage and trading patterns in response to the effects of China’s retaliatory import duty. Lower export volumes were shipped after the 2018 harvest and shifted to the second half of the marketing year. As the China tariffs continued, the United States made two adjustments. First, exporters positioned supplies and stocks to spread more evenly over the year to meet ROW demand, adding costs to holding soybeans year-round. Second, with ROW demand growing at a slower pace than China’s demand, year-over-year increases in U.S. exports would be expected to expand more slowly than seen in prior years. With slower growth in ROW demand, prices signaled U.S. producers to reduce soybean acreage.
Stock holding patterns will also have to change for South America. South America typically exports after harvest during March through August. If China’s retaliatory tariff on U.S. soybeans continue, growth in soybean imports will largely depend on the capacity of South American producers to expand production to meet China’s demand, which is currently higher than South America’s exportable supply. Higher prices would signal South American producers to increase production, but with the added need to be able to store soybeans year-round.
The price wedge between U.S. and South America would likely have continued if China had not begun importing soybeans from the United States despite the 25% import tariff. However, by late December 2018, the price wedge began to disappear (Figure 4). Prices between the United States and South America converged for three primary reasons. First, South American weather was favorable, enhancing prospects for a large harvest in early 2019. Second, China agreed to purchase soybeans from the United States, causing U.S. prices to rise. On November 30, China publicly announced during negotiations that it would purchase 5 million tons of U.S. soybeans, followed by another 5 million tons on January 31, 2019, and 10 million tons on February 22, 2019.
Last, Brazilian prices declined and converged with U.S. prices because China’s soybean demand softened. China detected African Swine Fever (ASF) in the hog population in August 2018, which negatively affected pork production and thereby soybean meal demand. China also announced it would diversify feedstocks away from soybean purchases to help mitigate the impact of the tariff on U.S. soybeans. This included a possible shift in feed rations to more corn and alternative oilseed meals, such as rapeseed, peanut, and fishmeal. However, since soybean meal substitutes (rapeseed meal, peanut meal, cottonseed meal, etc.) only account for about a quarter of total protein meal demand and the soybean meal-to-corn price ratio still favored meal, a significant shift in rations seems unlikely.
By January 2019, these three factors had pressured U.S. and South American prices to return to a more typical historical relationship (Figure 4). Periodic reports of a potential trade agreement also supported U.S. prices, particularly during times when China made large one-off soybean purchases despite the tariff. For example, at the time when the USDA National Agricultural Statistics Service (NASS) surveyed farmers in late February and early March for planting intentions, the Central Illinois new crop contract’s soybean-to-corn ratio was elevated near 2.5, which would not indicate a significant shift out of soybean acreage relative to prior years (Figure 8).
However, the NASS March 29, 2019, Prospective Plantings report showed that farmers intended to plant 84.6 million acres of soybeans in 2019, 4.6 million or 5% below the prior year. The uncertain environment over the tariffs, large stocks, and the convergence of U.S. and South American prices likely played a large role in the March 2019 Prospective Plantings report. Acreage declines were the most pronounced in Iowa, Minnesota, South Dakota, and North Dakota, which had been significant suppliers to the Chinese market. Producers in these states experienced larger price effects reflecting sharper basis adjustments out of the Pacific Northwest (PNW).
China’s tariff on U.S. soybeans and a record 2018 crop contributed to lower U.S. soybean prices in 2018/2019. While stocks increased across most producing states, the states that relied on shipments to China through the PNW faced relatively higher stocks and lower prices. With high stocks, low prices, and uncertainty about the tariff, producers surveyed in March 2019 indicated their intention to plant 5% fewer acres than the prior season, resulting in the largest acreage decline since 2007/2008.
South America benefited from China’s tariff on U.S. soybeans. Exports increased to record levels during the second half of their marketing year (August 2018–January 2019), when shipments normally decline. Higher exports led to historically low South American stocks. According to official Brazilian data, acreage expansion during planting in September–November 2018 only grew 2%, much lower than prior five-year average of 5%. This was possibly due to higher internal costs (freight rates) and limited availability of hedging mechanisms to capture the price premium over the United States due to the lack of a South American futures contract. Further, there was the risk that the United States and China could come to a resolution causing lower soybean prices in South America. Despite low acreage gains in Brazil, when combined with the return of Argentina’s crop after the prior year’s drought, South America would be able to continue to take advantage of market opportunities in China in 2019/2020.
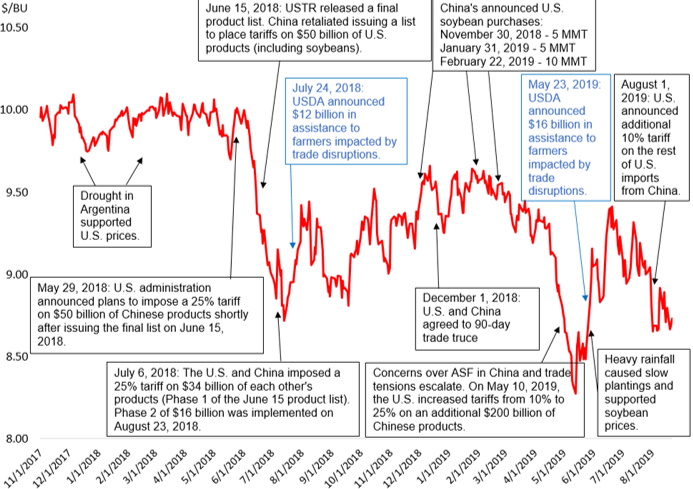
Source: Chicago Mercantile Exchange (2019) and authors’ annotated descriptions.
Uncertainty over a trade deal continues to play a large role in soybean market dynamics. Anticipation of a possible U.S.–China trade resolution continued into the spring of 2019, supporting U.S. prices. As U.S. and South American prices continued to move together, South America became more competitive in ROW markets, hindering the competitive edge the United States had maintained when there was a price wedge. Downward pressure on U.S. exports was exacerbated by shrinking global demand as demand in China softened. With a resurgence of trade tension in the spring, U.S. soybean prices continued to fall, bottoming out with the announcement of higher tariffs on $200 billion worth of Chinese products on May 10 (Figure 9).
Over one year has passed, and there is still much uncertainty regarding future trade negotiations. Since the release of the 2019 NASS Prospective Plantings report (USDA, 2019e), U.S. farmers faced the slowest planting pace since 1996 due to heavy rainfall, resulting in lower total acreage, including soybean acreage. Lower production supported U.S. prices, but if the tariff remains in place and China ceases to make one-off purchases from the United States, South American and U.S. prices will again diverge (as observed in August 2019 when the United States initially announced a 10% tariff on the remainder of U.S. imports from China).
With diverging prices, the United States will continue to supply markets outside of China while South America exports to China. To satisfy year-round demand, major exporters require a continuous supply, adding costs to store soybeans for longer periods. The United States will face slower year-over-year export demand growth, with demand outside China growing at a slower pace. This would delay stock reductions in the near-term until the United States produces less. Further, U.S. producers that rely heavily on PNW exports to China (and currently have high soybean stock levels) would likely switch to other crops.
With the continued Chinese tariff on U.S. soybeans, South American stocks will remain low over the time it takes to increase production capacity to meet China’s demand. Global stock and trade patterns will become less seasonal and more uniform, adding costs to producers. Last, two prices will persist: a higher price for China, benefiting South American producers, and a lower price for the United States, benefiting ROW importers.
Chicago Mercantile Exchange. 2019. 2019 November Soybean Futures Prices. Chicago, IL: Chicago Mercantile Exchange. Available online: www.cme.com.
Global Trade Atlas. (2019). IHS Markit. Available online: https://www.gtis.com/gta/.
International Grains Council. 2019. Export Prices. Washington, DC: International Grains Council. Available online: https://www.igc.int/en/markets/marketinfo-prices.aspx [Accessed November 7, 2019].
U.S. Census and Secretary of Foreign Trade, Brazil (SECEX), 2019. Trade in Goods with Brazil. Available online: https://www.census.gov/foreign-trade/balance/c3510.html.
U.S. Department of Agriculture. 2019a. Federal Grain Inspection Service. Washington, DC: U.S. Department of Agriculture, Agricultural Marketing Service. Available online: https://www.ams.usda.gov/about-ams/programs-offices/federal-grain-inspection-service.
U.S. Department of Agriculture. 2019b. Global Agricultural Trade System (GATS). Washington, DC: U.S. Department of Agriculture, Foreign Agricultural Service. Available online: https://apps.fas.usda.gov/Gats/default.aspx (Accessed various dates).
U.S. Department of Agriculture – (USDA-NASS). 2019c. National Agricultural Statistics Service. Washington, DC: U.S. Department of Agriculture, National Agricultural Statistics Service. Available online: https://www.nass.usda.gov/ [Accessed November 7, 2019].
U.S. Department of Agriculture. 2019d. Production, Supply and Distribution. Washington, DC: U.S. Department of Agriculture, Foreign Agricultural Service. Available online: https://apps.fas.usda.gov/psdonline/app/index.html [Accessed November 7, 2019].
U.S. Department of Agriculture. 2019e. Prospective Plantings. Washington, DC: U.S. Department of Agriculture, National Agricultural Statistics Service, March. Available online: https://www.nass.usda.gov/Publications/Todays_Reports/reports/pspl0319.pdf
U.S. Department of Agriculture. 2019f. USDA-IL Dept of Ag Market News. Springfield, IL: U.S. Department of Agriculture, USDA-IL Department of Ag Market News, Report GX_GR113. Available online: https://www.ams.usda.gov/mnreports/gx_gr113.txt [Accessed October 30, 2019].
U.S. Department of Agriculture. 2019g. USDA Market News. Washington, DC: U.S. Department of Agriculture, National Agricultural Statistics Service. Available online: https://www.ams.usda.gov/market-news/ [Accessed October 30, 2019].

