The United States is the second largest producer of tree nuts worldwide. Commercial tree nuts produced in the United States include almonds, pistachios, walnuts, pecans, hazelnuts, and macadamias. California is the sole producer of almonds, walnuts, and pistachios, accounting for 94% of the total U.S. tree nut production value. Pecans are produced in several states; from largest to lowest, the main commercial producers are New Mexico, Georgia, Texas, Arizona, and Oklahoma. Oregon is the main hazelnut-producing state, while the state of Washington only contributes 1% of total production. Total farm revenue for U.S. tree nut farming has expanded significantly, from $1.5 billion in 2000 to $9.5 billion in 2018 (USDA, 2020a). U.S. tree nuts are mainly exported to other countries, but the domestic demand for tree nuts is also steadily growing, supported by their promotion as nutritious and healthy snacks by government programs, marketing boards, and trade associations. However, environmental concerns, water shortage issues, labor shortfall, and trade issues challenge the sustainability of continued expansion in the United States. This article examines trends in tree nut supply, international trade, domestic demand, and current and future potential issues in the U.S. tree nut sector. This study further simulates changes in consumer spending on tree nuts and discusses potential policies to eliminate problems associated with increasing demand and sustainable tree nut supply in the United States.
Note: Because of the large almond production value, it is
represented by the entire area under the blue line; the values
of other tree nuts are illustrated by colored areas stacked on
one another.
Source: USDA (2020a).

Note: All the production figures are specified in shelled basis.
Because of the large almond production, it is represented by
the entire area under the blue line; all the other tree nuts are
illustrated by colored areas stacked on one another.
Source: USDA (2020a).
Note: All quantities are converted into shelled-nut basis.
Source: USDA (2020a).
Source: USDA (2020a).
Almonds are one of the most valuable crops, not only in California but for the nation (CDFA, 2020; USDA, 2020a). Pistachios and walnuts generate significant farm revenues in the long run; however, it is possible to observe a drop in revenue for some years because of the alternate-bearing characteristics of these crops (CDFA, 2020; UC Davis, 2020). Figures 1 and 2 illustrate trends in the value and utilized production of major commercial tree nuts in the United States from 2000 to 2018. Almond crop values have significantly increased, from $0.67 billion to $5.47 billion from 2000 to 2018, and the quantity of almonds produced has grown threefold over the same period. Almond crop values and utilized production are much higher than those of all other tree nut varieties combined. Between 2000 and 2018, pistachios increased the most in value (10.7 times higher in 2018 compared to 2000) and utilized production (4.3 times higher in 2018 compared to 2000). Walnuts and pecans have also shown noticeable growth in both crop values and utilized production quantities since 2000. Although hazelnuts constitute a small share of total tree nut production, the value of hazelnut production has increased 4.6 times in this period, demonstrating the third largest value growth behind pistachios and almonds.
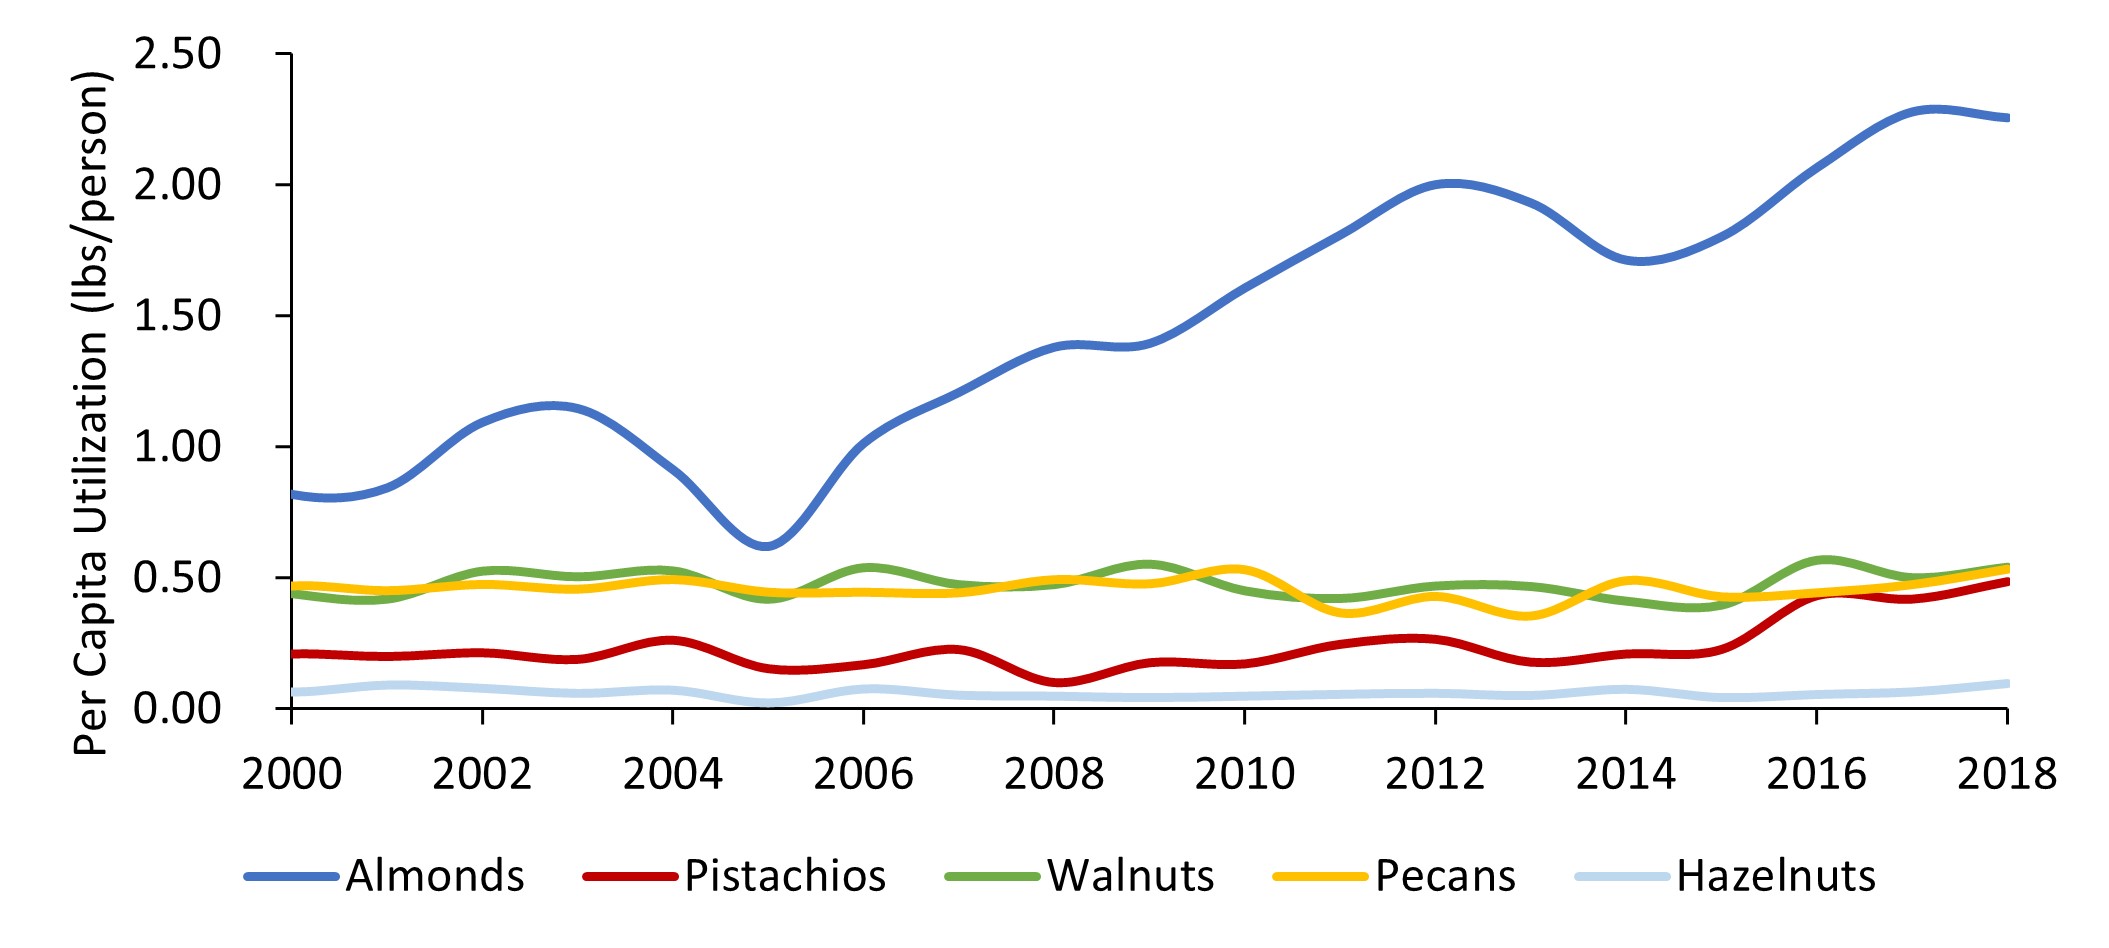
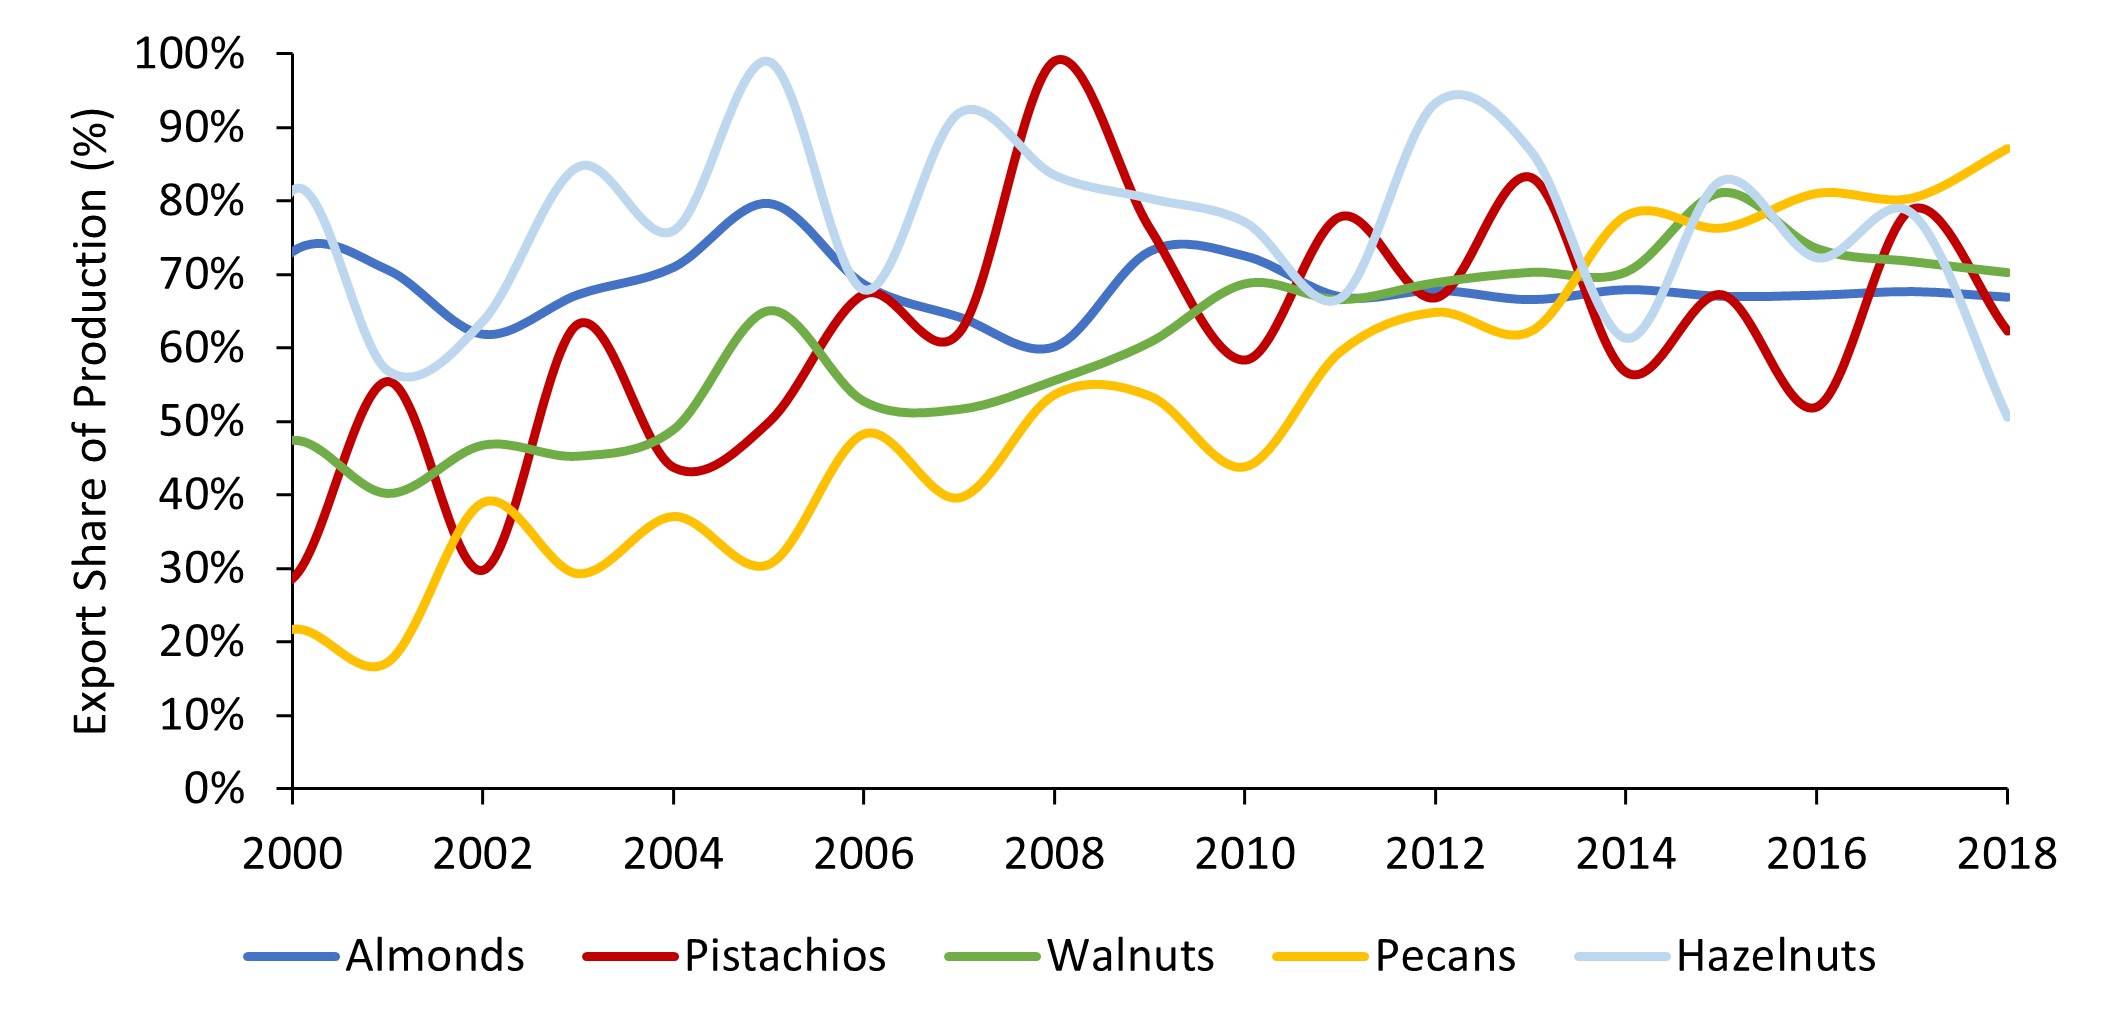
Annual per capita utilization of tree nuts has steadily increased since 2000, and consumption growth is mostly associated with the rising domestic utilization of almonds and pistachios in the United States (Figure 3). Annual per capita utilization of almonds increased from 0.8 pounds to 2.3 pounds, and the per capita utilization of pistachios went up from 0.2 pounds to 0.5 pounds between 2000 and 2018 (USDA, 2020a). On the other hand, per capita utilization for walnuts and pecans stayed around 0.5 pounds, and the per capita utilization for hazelnuts was the lowest at less than 0.1 pounds (USDA, 2020a). The increase in per capita consumption of almonds and pistachios can be attributed to the successful efforts of the Almond Board of California and American Pistachio Growers in marketing and boosting consumer demand (Almond Board, 2020; American Pistachio, 2020; Goodhue, Martin and Simon, 2018). Since 2008, over 50% of annual tree nut production has been directed toward export markets (Figure 4). For example, in the last decade, 70% of U.S. almond production and 75% of U.S. hazelnut production have been destined for export markets (USDA, 2020b). The United States is the largest almond producer and exporter in the world and one of the largest producers and exporters of pistachios and walnuts (CDFA, 2020). The figures show that pecan exports have increased significantly since 2000 while the domestic consumption of pecans has remained relatively unchanged. During this period U.S. pecan imports surpassed its exports as the increased production was not sufficient to fulfill both export and domestic demands. The United States also imports large quantities of hazelnuts to meet demand from the confectionary and chocolate industries (Hazelnut Marketing Board, 2020).
The growth of domestic and international demand for U.S. tree nuts has led to the replacement of traditionally grown crops in the U.S. with tree nuts (Goldhamer and Fereres, 2017). Although the nutritional value of tree nuts—which provide plant-based protein, fats, fiber, and micronutrients—is appreciated by an increasing number of consumers, increased tree nut production has become an issue of debate because of the consumptive use of water in production (Fulton, Norton, and Shilling, 2019). Multiyear drought conditions in California and other southern states, combined with groundwater management regulations, put mounting pressure on tree nut growers. For instance, the Sustainable Groundwater Management Act (SGMA), a response to rapid decline in groundwater levels in California, regulates groundwater pumping to keep water levels stable and limits groundwater access for many tree nut growers. A current study estimates that the act will cause a yield decline of about 20% in California tree nut production by 2060 (Sunding and Roland-Holst, 2020). Shrinking snowpack in the Sierra Nevada, combined with long periods of drought in California, have led to a decline in surface water allocations for San Joaquin Valley growers. In 2020, the Sierra Nevadas accumulated only 50% of their seasonal average snowpack by April as a result of the warmer winter, leading the Bureau of Reclamation to announce only a 15% initial allocation of contract water supply for some water districts in California (USBR, 2020).
Immigration policies create labor shortfalls for many specialty crop operations. Additionally, state labor requirements and mandates result in stricter and costlier labor regulations and a rising minimum wage. While most tree nuts are mechanically harvested in the United States, tree nut farming is still considered a labor-intensive endeavor (Martin, 2018). Thus, studies suggest that stricter immigration policies and labor regulations would increase labor costs for tree nut farming by 22% or more (Martin, 2017; Richard, 2018). The reliance of the U.S. tree nut industry on export markets makes these crops susceptible to international trade issues. Several countries—including China, Turkey, and India—have imposed retaliatory tariffs on U.S. tree nuts since 2018. The United States has suspended free trade agreement negotiations and pulled out of free trade agreements such as the Transatlantic Trade and Investment Partnership (T-TIP) and the Trans-Pacific Partnership (TPP). These agreements were expected to increase trade revenues for the industry, but the products are diverted to other export markets (Heron, 2016). A current study estimates that the trade divergence of almonds to other export destinations because of Chinese retaliatory tariffs may decrease total industry revenue by 0.43% (Asci et al., 2020).
Government nutrition assistance programs and the 2014 and 2018 Farm Bills encourage consumers to consume more fresh produce and nuts and to prepare healthier meals to meet the Dietary Guidelines for Americans (USDHHS and USDA, 2015). Consumers are also increasingly more concerned about eating healthier foods. Tree nuts are considered to be healthy foods due to their rich protein, fiber, and other essential nutrient content. Increasing health consciousness is driving the adoption of nut consumption in diets across the globe. Moreover, the use of tree nuts in bakery, confectionery, dairy, breakfast cereals, sports nutrition, and personal care products has also been growing in recent years. The fruit and nut farming industry is expected to continue growing over the next five years, consumer demand and government programs targeting consumption of tree nuts will likely contribute to this growth.
In the last decade, U.S. per capita tree nut consumption has increased significantly (USDA, 2020a). The main driver of changes in favorable consumer preferences for nuts is the promotion of tree nuts’ dietary benefits by marketing boards, trade associations, and government programs. In this section, we estimate the responsiveness of U.S. consumer demand for tree nuts to changes in prices and food expenditure using an economic concept called “elasticity.” Holding other prices and expenditures constant, elasticity measures the effect of a change in a tree nut price or its expenditure on quantity demanded of that tree nut. Next, we use these elasticity estimates to analyze how the general promotion of tree nuts through various government programs or marketing board efforts would affect consumer demand for specific types of tree nuts (USDA, 2020c). Using annual data on unit export prices and domestic consumption quantity between 1996 and 2018, we analyze the domestic consumer demand patterns for five U.S. tree nuts: almonds, pistachios, walnuts, pecans, and hazelnuts. We use export prices for this analysis because we lack annual consumer prices for tree nuts. Since most of the U.S. tree nut production is also destined for export markets, we can assume that these prices are closer to the domestic consumer prices, except the value addition from individual packaging, further processing, and retailing in the tree nut supply chain. A general differential demand model conforming to economic regularity conditions was used to estimate price and expenditure elasticities in Table 1. For detailed technical information on estimating such demand systems as well as calculating price and expenditure elasticities, readers can refer to Schmitz and Seale (2002) and Asci et al. (2016).
| Price Elasticities | Expenditure Elasticities | |||||
| Almond | Pistachio | Walnut | Pecan | Hazelnut | ||
| Almond | -0.12 | -0.04 | 0.10* | -0.07 | 0.06* | 1.26* |
| (0.12) | (0.08) | (0.06) | (0.09) | (0.03) | (0.19) | |
| Pistachio | 0.19 | -0.33 | -0.07 | 0.41 | -0.20 | 1.45* |
| (0.40) | (0.43) | (0.22) | (0.26) | (0.16) | (0.51) | |
| Walnut | 0.22* | -0.03 | -0.16 | -0.03 | 0.00 | 0.85* |
| (0.12) | (0.09) | (0.10) | (0.12) | (0.05) | (0.23) | |
| Pecan | -0.09 | 0.10 | -0.02 | -0.08 | 0.09* | 0.53* |
| (0.11) | (0.06) | (0.07) | (0.15) | (0.03) | (0.30) | |
| Hazelnut | 1.03* | -0.71 | -0.03 | 1.25* | -1.29 | 2.71* |
| (0.57) | (0.56) | (0.39) | (0.43) | (1.02) | (0.82) | |
Notes: Asterisks (*) denote the elasticities are statistically significant at 10% level. Numbers in parenthesis
are approximate standard errors. Elasticities are calculated at mean values of data. Expenditure elasticities
are computed conditional on total tree nut expenditures. Price elasticities are the so-called “Slutsky” variation.
The own-price elasticities are reported along the diagonals, and they explain the percentage change in domestic quantities of nuts consumed when the price of the same nut changes by a percentage point. The sign of all own-price elasticities are negative as expected due to the law of demand; however, they are not statistically different from zero. The cross-price elasticities are reported on off-diagonals and explain the percentage change in domestic quantities of nuts consumed when the price of an alternative nut changes by a percentage point, holding total expenditures on tree nuts constant. Positive cross-price elasticities indicate that two varieties of nuts are substitutes from the consumer’s point of view, while negative cross-price elasticities indicate complementarity among different tree nuts. The following combinations of nuts have positive and statistically significant cross-price elasticities at the 10% level: almonds–walnuts, almonds–hazelnuts, and pecans–hazelnuts. Conditional expenditure elasticities reported in the last column of Table 1 indicate the expected percentage change in spending for a tree nut variety when the total expenditures for all nuts change by a percentage point. All expenditure elasticities, except for that of pecans, are positive and statistically significant at the 1% level. The expenditure elasticity for pecans is significant at the 10% level. Hazelnuts have the highest expenditure elasticity, 2.71, followed by pistachios, almonds, walnuts, and pecans. Therefore, U.S. consumers spend relatively more on hazelnuts as their total spending on tree nuts increases.
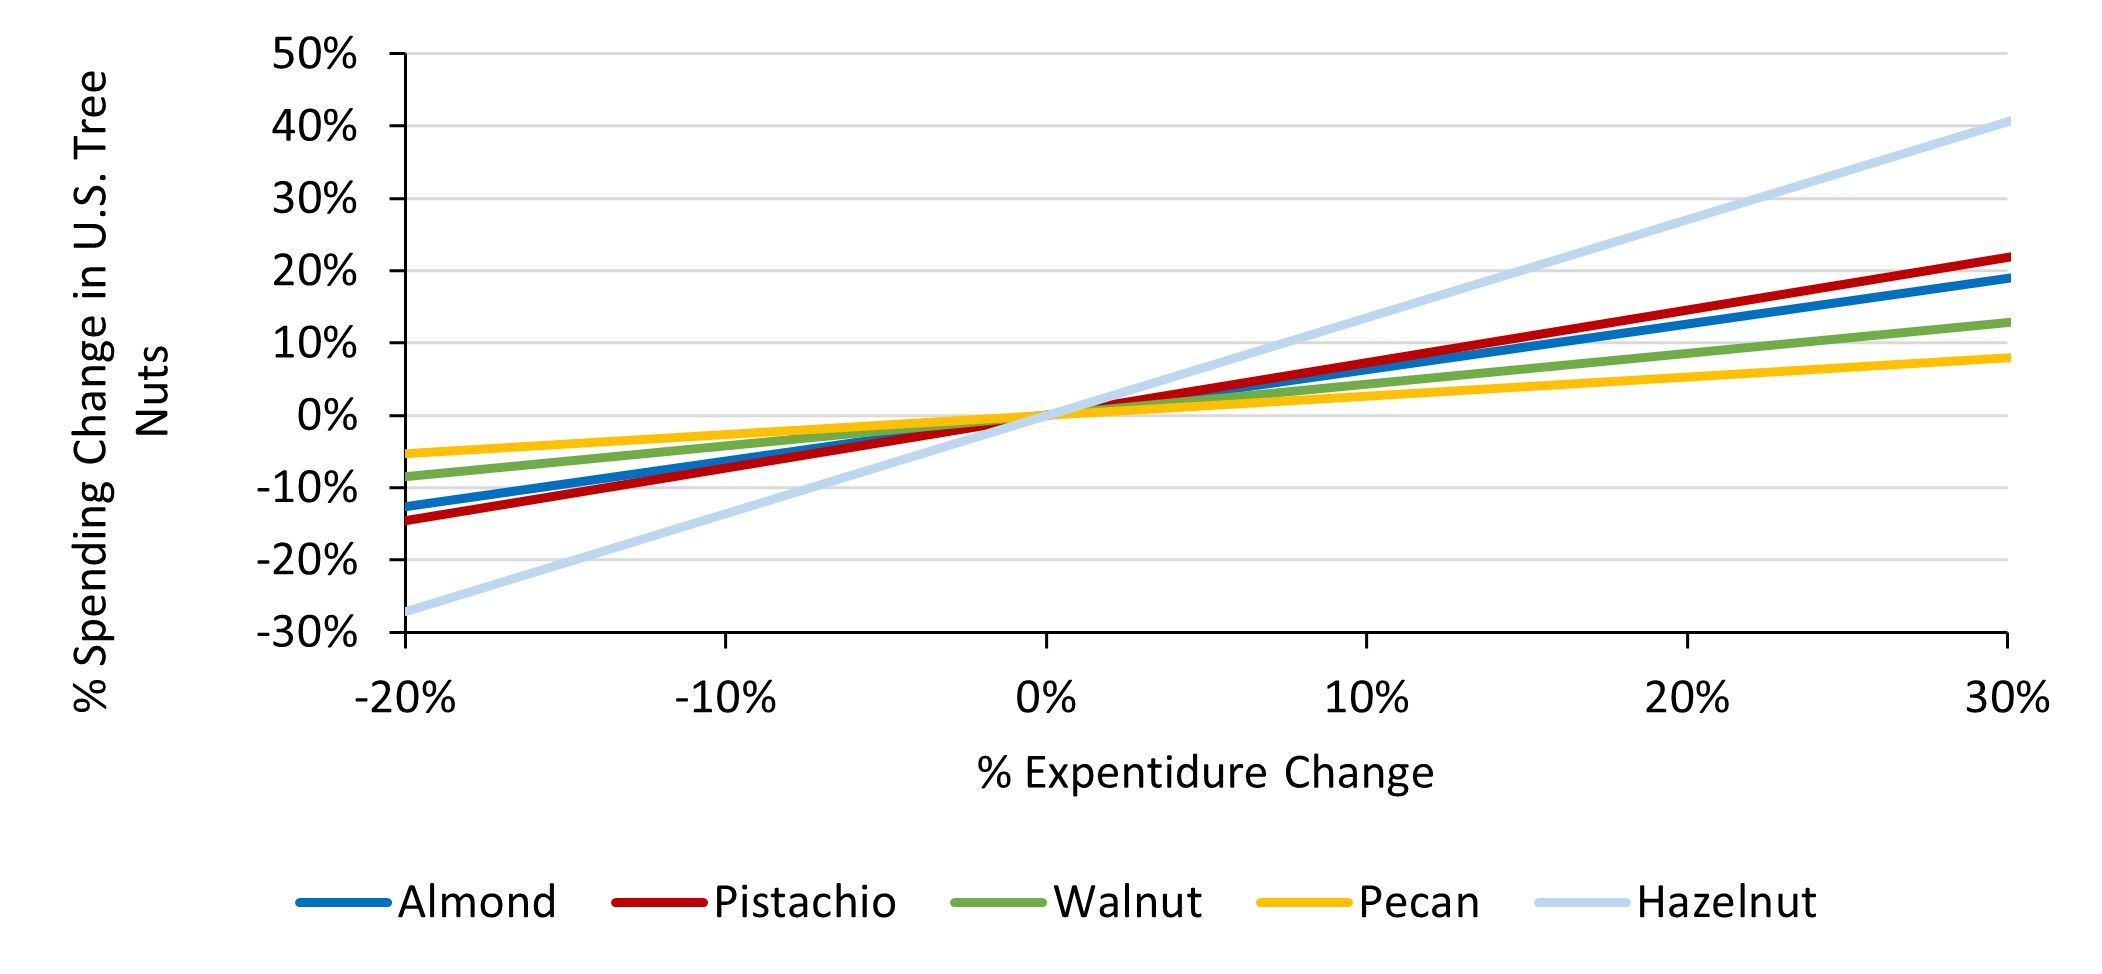
Source: Calculated by authors using the expenditure elasticity
estimates.
Lastly, we simulate possible effects of federal nutrition programs and favorable promotions on the quantity demanded of each tree nut using the estimated elasticities reported in Table 1 (Figure 5). The chart shows the simulated percentage change in spending for each type of U.S. tree nut with respect to the percentage change in total nut expenditures, holding prices constant. When we observe a 30% increase in consumers’ total expenditure on tree nuts, spending on hazelnuts, pistachios, and almonds increases by 40%, 21%, and 19%, respectively, while spending on walnuts and pecans increases only slightly. On the other hand, if total U.S. expenditures on tree nuts decreased, hazelnuts would be impacted most negatively, followed by pistachios, almonds, walnuts, and pecans.
Overall, demand for tree nuts continues to grow in the United States and around the world. Consumers’ growing interest in the nutritional benefits of tree nuts, expanding use of tree nuts in various processed food items, and promotional campaigns by government programs and trade associations to encourage tree nut consumption are the main drivers for this increasing demand. The United States dominates total world production of almonds and pecans and is a major global producer of pistachios and walnuts. However, major export competitors—including Australia, Iran, Turkey, and Chile—are adding more acreage for tree nut production. The U.S. tree nut industry is prone to showing negative long-term response to changes in government regulations and trade policies. Therefore, tree nut operations may shift out of states with high regulations and costs into states with fewer regulations and other bureaucratic restrictions on water and labor. Taken together, our analysis suggests that the growing consumer interest and promotional campaigns can significantly increase domestic spending on tree nuts to varying degrees depending on the type of tree nut. Growing demand for tree nuts will likely lead to additional land allocation for domestic tree nut production, increased tree nut imports, or both.
Almond Board of California. 2020. Health and Nutrition. Modesto, CA: Almond Board of California. Available online: https://www.almonds.com/why-almonds/health-and-nutrition.
American Pistachio Growers. 2020. Pistachio Nutrition Power. Fresno, CA: American Pistachio Growers. Available online: https://americanpistachios.org/nutrition-and-health.
Asci, S., J.L. Seale Jr., G. Onel, and J.J. VanSickle. 2016. “U.S. and Mexican Tomatoes: Perceptions and Implications of the Renegotiated Suspension Agreement.” Journal of Agricultural and Resource Economics 41(1): 138–160.
Asci, S., K. Ramaswamy, S. Devadoss and S. Konduru. 2020. “Modern Time Trade Wars: Chinese Retaliatory Tariffs vs California’s Tree Nut Industry.” Paper presented at the virtual meeting of the Agricultural and Applied Economics Association, Kansas City, MO.
California Department of Food and Agriculture. 2020. California Agricultural Statistics Review, 2018-2019. Sacramento, CA: CDFA. Available online: https://www.cdfa.ca.gov/statistics/PDFs/2018-2019AgReportnass.pdf.
Fulton, J., M. Norton, and F. Shilling. 2019. “Water-Indexed Benefits and Impacts of California Almonds.” Ecological Indicators 96: 711–717.
Goldhamer, D.A., and E. Fereres. 2017. “Establishing an Almond Water Production Function for California Using Long-Term Yield Response to Variable Irrigation.” Irrigation Science 35(3): 169–179.
Goodhue, R.E., P.L. Martin, and L.K. Simon. 2018. “California’s Fruits and Tree Nuts.” In P.L. Martin, R.E. Goodhue, and B.D. Wright, eds. California Agriculture: Dimensions and Issues. University of California Giannini Foundation of Agricultural Economics Information Series 18-01. Available online: https://s.giannini.ucop.edu/uploads/giannini_public/06/53/0653cf3a-1b90-4c5c-a953-65add012e856/california_fruits_and_nuts.pdf.
Hazelnut Marketing Board. 2020. Hazelnuts for Food Professionals. Wilsonville, OR: Hazelnut Marketing Board. Available online: http://oregonhazelnuts.org/food-professionals/.
Heron, J. 2016. “Trans-Pacific Partnership Presents Unique Trade Opportunity for Co-op.” July-August Almond Facts. Available online: https://www.bluediamondgrowers.com/almondfacts/Jul-Aug-2016/files/assets/basic-html/.
Martin, P.L. 2017. Immigration and Farm Labor: From Unauthorized to H-2A for Some? Washington, DC: Migration Policy Institute.
Martin, P.L. 2018. “Immigration and Farm Labor: Challenges and Opportunities.” In P.L. Martin, R.E. Goodhue, and B.D. Wright, eds. California Agriculture: Dimensions and Issues. University of California Giannini Foundation of Agricultural Economics Information Series 18-01. Available online: https://s.giannini.ucop.edu/uploads/giannini_public/dd/d9/ddd90bf0-2bf0-41ea-bc29-28c5e4e9b049/immigration_and_farm_labor_-_philip_martin.pdf.
Richard, T.J. 2018. “Immigration Reform and Farm Labor Markets.” American Journal of Agricultural Economics 100(4): 1050–1071.
Schmitz, T.G., and J.L. Seale Jr. 2002. “Import Demand for Disaggregated Fresh Fruits in Japan.” Gainesville, FL: University of Florida, Gainesville, International Agricultural Trade and Policy Center, Technical paper TPTC 02-1.
Sunding, D., and D. Ronald-Holst. 2020. “Blueprint Economic Impact Analysis: Phase One Results.” Berkeley, CA: University of California, Berkeley, Working Paper. Available online: https://www.restorethedelta.org/wp-content/uploads/SJV-Blueprint-for-Extinction-Economic-Study-2-15-2020.pdf.
U.S. Bureau of Reclamation. 2020, February 25. “Reclamation Outlines Central Valley Project initial 2020 Water Allocation.” Sacramento, CA: U.S. Bureau of Reclamation, News Release. Available online: https://www.usbr.gov/newsroom/newsrelease/detail.cfm?RecordID=69603.
U.S. Department of Agriculture. 2020a. Fruit and Tree Nuts Yearbook Tables. Washington, DC: U.S. Department of Agriculture, Economic Research Service. Available online: https://www.ers.usda.gov/data-products/fruit-and-tree-nuts-data/fruit-and-tree-nuts-yearbook-tables/.
U.S. Department of Agriculture. 2020b. Global Agricultural Trade System. Washington, DC: U.S. Department of Agriculture, Foreign Agricultural Service. Available online: https://apps.fas.usda.gov/gats/Default.aspx.
U.S. Department of Agriculture. 2020c. Fruit and Tree Nuts - Policy. Washington, DC: U.S. Department of Agriculture, Economic Research Service. Available online: https://www.ers.usda.gov/topics/crops/fruit-tree-nuts/policy/.
U.S. Department of Health and Human Services and U.S. Department of Agriculture. 2015. 2015 – 2020 Dietary Guidelines for Americans. 8th Edition. Available online: https://health.gov/our-work/food-nutrition/previous-dietary-guidelines/2015.
University of California, Davis. 2020. Alternate Bearing. Davis, CA: University of California, Davis, Fruit and Nut Research and Information Center. Available online: http://fruitandnuteducation.ucdavis.edu/generaltopics/Tree_Growth_Structure/Alternate_Bearing/.

