4th Quarter 2013
Few would disagree that farmers face substantial risks from Mother Nature and markets alike, and that farmers must make crucial decisions balancing risk and reward on a regular basis. However, little consideration has been given to how the risk endemic to farming has shaped who has entered and stayed in farming and the risk tolerance of the farmers that remain. For example, has the constant exposure to and experience with risk made U.S. farmers better able to tolerate risk than the general population? Have government programs designed to help manage and mitigate farm risk allowed farmers with less tolerance for risk to survive where those with similar risk tolerance in nonfarm businesses may have exited? Are there other distinct features of the farming sector, such as specialized assets, inheritance, or land wealth, that interact with occupational sorting to affect the distribution of risk tolerance among farmers?
One view of the role that risk attitudes play within the economy is that individual risk attitudes influence the genesis of firms and, hence, industrial organization (Knight, 1921). Specifically, risk-tolerant individuals seek entrepreneurial activities such as owning a small business or becoming otherwise self-employed, while the risk intolerant gravitate toward employee status. Several studies have validated this logic using a variety of different data sets and indicators for risk tolerance (Cramer et al., 2002; van Praag and Cramer, 2001; Xiao et al., 2001; and Hvide and Panos, 2013), though none have explored differences between farming and other occupations. This is critical because farming differs from other forms of small business ownership and self-employment on several fronts.
Sometimes entering farming is more the outcome of intergenerational inertia than of a free, unfettered choice among all feasible professions (Laband and Lentz, 1983). Some would argue that, more than other forms of small business, family ties are crucial to farming entry decisions because such ties often provide the key knowledge, experience, and skills necessary to become a successful farmer. And that’s not to mention the fact that family ties often provide the access to land and other crucial assets. So, while the nonfarm child who loves risk may choose to run a small business rather than take a salaried job, the child of a farmer who, deep down, doesn’t really like to take risks, may end up running the family farm even if that salaried job was available. Furthermore, such decisions may have intergenerational implications as mounting evidence suggests that risk attitudes are passed from generation to generation (Dohmen et al., 2012; and Zhong et al., 2009). Farming is also different in that federal and state programs provide assistance to farmers in managing downside risk in the forms of subsidized insurance products and income support through various program payments, though the availability and scope of programs has differed by agricultural product (e.g., row crops versus horticultural products) and by year due to differences across farm bills.
The fundamental objective of this article is to provide a description of the risk tolerance of farmers relative to the general population and relative to nonfarm businesses. To assess the relative risk tolerance of U.S. farmers, I worked with a commercial polling firm to conduct several national phone surveys. In some surveys, farm and nonfarm business owners were oversampled to ensure a sample large enough to provide sufficient statistical power. Weights were applied to both farm and business owner samples so that they would be nationally representative of farm and business owner age, race, and gender. To assess risk tolerance, the following question was asked: “How do you see yourself? Are you generally a person who is fully prepared to take risks or do you try to avoid taking risks?” Respondents were told to rate themselves on an eleven point scale where the lowest value corresponded to the statement “Don’t like to take risk” and the largest value corresponded to the statement “Fully prepared to take risks.”
The answer to this question proved effective in predicting a broad range of observed behaviors when used by other researchers. For example, this question was asked of tens of thousands of Germans as part of a large, ongoing study of the German population. Researchers found that it predicted behavior such as smoking, traffic offenses, investment behavior, willingness to migrate, and likelihood of self-employment (Jaeger et al., 2010; and Dohmen et al., 2011). It also predicted behavior in subsequent lab experiments where respondents bet real money on uncertain outcomes. Perhaps most importantly, it has been shown to predict U.S. farmers’ past and intended use of the Internet to buy and sell used farm equipment even after controlling for other confounding factors such as age, gender, income, farm size, and trust attitudes (Roe, Batte, and Diekmann 2013).
The core results of risk tolerance from the sample are displayed in Figure 1. The black bars furthest left in each cluster are the general population results while the green bars furthest right are nonfarm business owners. The bars in the middle are various farm samples including all farmers (purple), farmers reporting growing row crops, field crops, hay, grass or dairy animals (cross-hatched gray) and farmers reporting the receipt of income from the Federal government for participation in commodity, conservation or disaster aid programs.
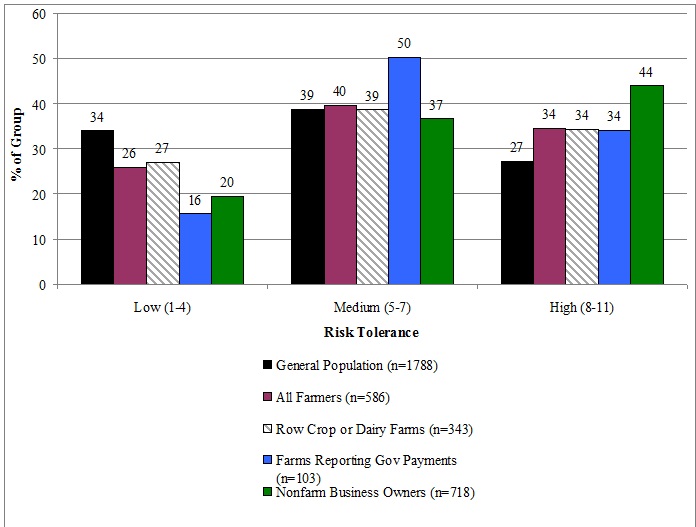
The pattern among the bars in Figure 1 is quite clear: risk tolerance differs across the three population segments. For example, the first cluster of bars on the left displays the percent of each professional group that rates themselves as being intolerant of risk (i.e., a rating of four or less). About one-third of the general population is in this least-risk-tolerant group while only 20% of nonfarm business owners are in this group. Farmers fall in between, with about one in four describing themselves with a rating of four or less.
In the far right cluster of bars, the stair-step pattern is reversed, with 27% of the general population rating itself in the highly risk tolerant group (a rating of eight or above) and 44% of nonfarm business owners rating themselves similarly. Once again, farmers are in between the general population and the nonfarm business population, with 34% of farmers falling in this most-risk-tolerant group. Nearly all population segments have about 40% of people identifying themselves in the middle risk tolerance group. Further analysis confirms that farmers are indeed less risk tolerant than nonfarm business owners. However, farmers are more risk tolerant than the general population sampled.
Why do farmers—who surely face more risk than the general population and perhaps similar risk to their nonfarm business counterparts—turn up as the middle group? To understand, consider a key difference between these three groups: age (Table 1). Farmers are much older than nonfarm business owners who themselves are older than the general population. This is important, given the focus on risk tolerance, because many researchers have documented a general decline in risk-taking behavior as people age (Dohmen et al., 2011; Barsky et al., 1996; and Mandal and Roe, In Print), suggesting one possible avenue for the observed difference in risk tolerance between farmers and nonfarm business owners.
| General Population | Farmers | NonFarm Business Owners | |
|---|---|---|---|
| Age | 46.8 | 57.9 | 50.3 |
So, now the interesting question is: if we adjust for differences in age, what changes result? Figure 2 focuses on just farmers and nonfarm business owners and compares risk tolerance across those in similar age groups.
For those less than age 48, there is no difference in risk tolerance between farm and nonfarm business owner. In the middle group—those between 48 and 62 years of age—there is no longer a similar risk tolerance profile between farm and nonfarm business owners. For nonfarm business owners, about 45% are in the most highly risk-tolerant category.
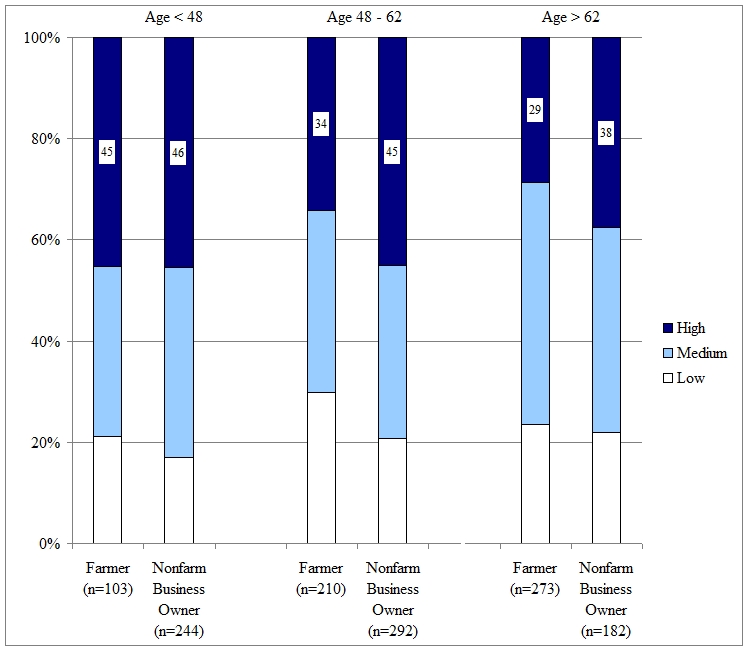
However, only about one-third of farmers are in this highest risk tolerance category, while the number in the lowest risk tolerance category grows to 30%. For the older-than-65 group, some of the same differences observed in the middle group emerge, e.g., a higher percentage of the nonfarm group is in the highest risk tolerance category than is in the farm group. However, the membership in the low-risk-tolerant group is approximately equal.
This simple survey suggests that, as a population, farmers sit in the middle of risk tolerance between the more reticent risk attitudes of the general population and the more tolerant viewpoint of nonfarm business owners. However, this coincides with the fact that farmers are older than the general population. Indeed, among the youngest cohorts of farm and nonfarm business owners, risk attitudes are indistinguishable. It is only when comparing farm and nonfarm business owners who are in the middle age group or later, when the effects of aging may naturally erode human risk tolerance (Mandal and Roe, In Print) that we see nonfarm business owner risk tolerance surpass that of farmers.
Farm programs are also a distinct feature of the agricultural sector and remain a perennial topic of policy discussion regarding risk mitigation. From the 2007 Census of Agriculture, we know that 38% of U.S. farmers received some portion of the nearly $8 billion in government farm payments, with an average payment exceeding $9,500 per farm. Given recent political discussions of continued funding for farm payments, and the recent trend of directing policies toward insurance-based programs, the relative risk tolerance of farmers appears to be appropriate to the risk discussion.
To further explore how farm program availability may correlate with farmer risk tolerance, we can look at the farm subsamples in Figure 1. Most of the farmers surveyed were asked about the specific enterprises present on their farm and whether they had received income from Federal farm programs. The row and field crop sectors and the dairy sector have been the focus of numerous Federal government programs aimed at stabilizing farm incomes or helping manage farm risks over many decades. Hence, focusing on farmers in these sectors may be instructive to thinking about the risk tolerance composition of sectors with a history of Federal support. The subsample of farmers from sectors with a history of farm program payments tracks closely with the overall sample of farmers in terms of risk tolerance categories (Figure 1, cross-hatched gray bars versus solid gray bars). Statistical tests reject any significant differences between farmers in these sectors and the farmers not involved in these sectors.
Another way to parse the data is to compare those who report actually receiving Federal farm program monies (checkered gray bars) to farmers who do not report receiving such compensation. This group appears distinct from the overall farm sample as fewer program income recipients appear in the lowest risk category and more appear in the middle risk tolerance category. Formal tests verify the statistical significance of this difference between the two groups of farmers and between farmers reporting government payments and nonfarm business owners. However, the percent of farm payment recipients in the highest risk tolerance category is nearly identical to the overall farm population. It must be noted that only 19.3% of the weighted farm sample from the survey data reports receiving farm payment benefits, which is significantly less than 38% of farmers receiving Federal farm program payments in the 2007 Census of Agriculture.
Does the difference in risk tolerance between farmers and nonfarm business owners or between farmers and the general population or between farm program payment recipients and non-recipients in this sample have implications for production agriculture in the United States? Some studies suggest that lower risk tolerance within a sector can lead to lower sectoral wages and returns (Khilstom and Laffont, 1979; and Friedman, 1953), but little empirical work exists testing such conjectures. One might imagine that those who are more risk tolerant may make more reckless decisions, but they may also make more bold and innovative decisions.
The finding that farmers have greater risk tolerance than the general population also leads to some interesting questions. For example, should federal policy focus on subsidizing risk management programs for a population like farmers that is more tolerant of risk than the general population? Or do risk management programs benefit both farmers and the general population by stabilizing farm sector production and food prices?
Farming risk will not dissipate. Therefore, understanding the ability of farmers to tolerate risk is an important endeavor. Furthermore, understanding how the pressures of farming, and how the peculiarities of the farm sector—including inheritance, farm programs, and sector-specific human and physical capital—may sort people with different risk tolerance in and out of farming remains a relevant area for future study.
Barsky, R. B., Juster, F. T., Kimball, M. S., and Shapiro, M. D. (1997). Preference parameters and behavioral heterogeneity: An experimental approach in the health and retirement study. The Quarterly Journal of Economics, 112(2), 537-579.
Cramer, J.S., Hartog, J. Jonker, N. and van Praag, C.M. (2002). Low risk aversion encourages the choice for entrepreneurship: An empirical test of a truism. Journal of Economic Behavior and Organization, 48,29-36.
Dohmen, T., Falk A., Huffman,D., and Sunde, U. (2012). The intergenerational transmission of risk and trust attitudes. Review of Economic Studies, 79, 645-677.
Dohmen, T.J., Falk, A., Huffman, D., Sunde, U., Schupp, J., and Wagner, G.G. (2011). Individual risk attitudes: measurement, determinants and behavioral consequences. Journal of the European Economic Association, 9(3), 522-550.
Friedman, M. (1953). Choice, chance and the personal distribution of income. Journal of Political Economy, 61(4), 277 – 290.
Hvide, H. K. and Panos, G. A. (In Press). Risk tolerance and entrepreneurship. Journal of Financial Economics.
Jaeger, D.A., T. Dohmen, T, Falk, A., Huffman, D., Sunde, U., and Bonin, H. (2010). Direct evidence on risk attitudes and migration. Review of Economics and Statistics, 92(3), 684-689.
Kihlstrom, R.E. and Laffont, J. (1979). A general equilibrium entrepreneurial theory of firm formation based on risk aversion. Journal of Political Economy, 87(4), 719-748.
Knight F. H. 1921. Risk, Uncertainty and Profit. Reprinted in 2002 by Beard Books, Washington, DC.
Laband, D.N. and Lentz, B.F,. (1983). Occupational inheritance in agriculture. American Journal of Agricultural Economics, 65(2), 311-314.
Mandal, B. and Roe, B.E.. (In Press). Risk tolerance among National Longitudinal Survey of Youth participants: The effects of age and cognition skills. Economica.
Roe, B. E., Batte, M.T., and Diekmann, F. (in press). Competition between local dealerships and Internet markets: The role of local relationships, risk tolerance and trust in used farm machinery markets. Agribusiness: An International Journal.
Van Praag, C.M. and Cramer, J.S. (2001). The roots of entrepreneurship and labour demand: Individual ability and low risk aversion. Economica, 68(269), 45-62.
Xiao, J.J., Alhabeeb, M.J. Hong, G., and Haynes, G.W. (2001). Attitude toward risk and risk-taking behavior of business-owning families. Journal of Consumer Affairs, 35(2), 307-325.
Zhong, S., Chew, S.H., Set, E., Zhang, J., Xue, H., Sham, P.C., Ebstein, R. P., and Israel, S. (2009). The heritability of attitude toward economic risk. Twin Research and Human Genetics, 12(1), 103-107.

