The Farm Service Agency (FSA) serves a pivotal role in agricultural finance as the “lender of last resort,” relieving farmers from the strain of often unsuccessful loan application stints in the highly competitive mainstream credit market. Regular lenders’ assessments of agricultural loan applications usually amplify the sector’s more significant, vulnerable exposure to business risks—especially sudden weather disturbances and market volatilities—relative to other industries. Thus, regular lenders are more cautious and highly selective in their credit decisions, leading to farmers’ frustrations in loan transactions and, at times, breeding loan aversion attitudes among conservative farmers (Jones, Escalante, and Rusiana, 2015). Given these considerations, the FSA intervenes and offers to provide farm borrowers with “interim” financial resources to help them to develop greater financial strength and business confidence until they can eventually gain regular lenders’ favor.
FSA’s loan programs are regulated by government mandates for regular allocation of FSA loanable funds for farmers collectively labeled as socially disadvantaged in terms of racial, ethnic, or gender minority status. This directive ensures more equitable credit access for socially disadvantaged farmers in case their status becomes a hurdle in their borrowing experiences. The Agricultural Credit Act of 1987 and subsequent laws (such as the Food, Agriculture, Conservation, and Trade Act of 1990 and a series of farm bills) ensure that federal funds are set aside to accommodate beginning and socially disadvantaged farmers under the FSA’s direct and guaranteed loan programs (Koenig and Dodson, 1999; The White House, 2000).
FSA lending policies have been designed to carefully consider the business realities surrounding theoperations of socially disadvantaged farmers. Previous studies clarify that these farmers typically run smaller (in terms of both revenues and assets) and less profitable operations (Escalante et al., 2006; Escalante et al., 2018; Ghimire et al., 2020). Hence, FSA has modified its lending guidelines to become more “inclusive” and “accommodating” of its socially disadvantaged borrowers. Specifically, FSA has redefined its “creditworthiness” standard and recalibrated its borrower classification model in ways that deviate from regular commercial lending norms so that more, if not all, socially disadvantaged borrowers can successfully obtain FSA credit. The latter mechanism, which allows for greater objectivity in loan approval decisions, also seeks to quell and resolve past and impending allegations of discriminatory, subjective lending decisions.
As a background, the FSA uses a farm borrower classification system where borrowers are categorized into several classes by scoring specific individual financial performance indicators and calculating an overall weighted score. This classification scheme is used, among other considerations, by loan officers when they make loan approval and packaging decisions. This model’s counterpart used by commercial banks is the credit risk (scoring) classification model. This article will later explain how the FSA model is a downgraded (less stringent) version of the commercial bank model in its choice of financial measures, delineation of ratio intervals, and weighing of selected financial measures.
This article utilizes a national dataset of FSA borrowers with approved direct loans from 2004 to 2014 to demonstrate how socially disadvantaged borrowers fare under FSA’s less stringent borrower classification model relative to other borrowers. The model’s counterpart in the commercial lending sector is also applied to understand the regular lenders’ assessment of these borrowers and uncover variations in borrowers’ credit ratings arising from the choice of financial measures and the model’s weighing scheme.
The subsequent sections present a progression of FSA’s lending predicament that starts with its seminal unconventional definition of “creditworthiness.” Such leniency was challenged by a surge of lending discrimination allegations that, in turn, emphasized the need for greater objectivity in its loan approval decision mechanism. The resulting, more objective FSA borrower classification model—a less stringent version of the commercial banking model—is then used to analyze the socially disadvantaged borrowers’ credit classifications relative to other borrowers.
Beyond targeted funding allocations, the FSA’s mission to serve “socially disadvantaged farmers” is reflected in some special consideration clauses in its credit risk appraisal policies. According to their lending guidelines, a borrower’s “credit history” should be assessed with the following exceptions that do not constitute “delinquency” or “unacceptable credit history:” (i) any foreclosure, judgment, bankruptcy, or delinquent payment caused temporary circumstances and were beyond the borrower’s control; (ii) isolated instances of late payments that do not indicate an overall delinquency pattern; and (iii) lack or absence of history of credit transactions (USDA-FSA, 2001).
These concessions reflect an unusual leniency that regular, commercial lenders would typically not grant to their loan clients. These commercial lenders impose straightforward, strict definitions of delinquency, which would not make any distinction between factors within or beyond the borrower’s control. Compared to their regular lending peers, the FSA more aptly leans toward accommodating farm borrowers based on their business potential (even when current indicators may fall short of regular credit standards), with the underlying motive to assist these borrowers in their efforts and aspirations to operate more viable, competitive businesses.
programs, however, had been challenged by multiple individual and class action lawsuits filed by farmers who claim to be victims of FSA’s discriminatory lending practices (Escalante et al. 2006; Escalante, Epperson, and Raghunathan, 2009; Escalante et al., 2018; Ghimire et al., 2020). The landmark case, Pigford v. Glickmann, originally started as individual lawsuits and eventually succeeded in elevating their cases to class action lawsuit status that covered other, eligible African American farmer complainants. Subsequently, more lawsuits were filed by other minority farmer groups, including American Indian (Keepseagle v. Vilsack), Hispanic American (Garcia v. Vilsack), and women (Love v. Vilsack) farmers, among many others (Feder and Cowan, 2013).
The USDA settled these cases by providing cash remunerations, in addition to tax and debt relief provisions, to farmers who complied with documentary evidence requirements (May, 2012). During the Obama administration, settlements with African American, American Indian, Hispanic American, and women farmers had already exceeded $4 billion in federal funds (Feder and Cowan, 2013).
Unfair lending decisions that fuel allegations of bias and discrimination emanate from lending officers’ tendency to favor certain types of borrowers and exclude others. In the minority farmers’ lawsuits against the USDA, race and/or gender were the alleged underlying bases of selective credit decisions. Logically, the apparent remedy to minimize and possibly eradicate lending officers’ discrimination tendencies would be the objectification of the credit risk assessment model.
Lenders’ loanable fund supplies are usually limited and could only satisfy a portion of all clients’ loan requests; hence, lenders usually resort to credit rationing, which requires the careful identification of a select group of borrowers they can accommodate (Turvey and Weersink, 1997). The selection procedure varies across lenders and may be influenced by their level of tolerance of borrowers’ risk profiles and levels, market competition, and institutional policies. These then form the benchmarks of lenders’ credit risk assessment and credit scoring models (Miller and LaDue, 1989; Turvey, 1991; Splett et al., 1994).
Credit risk assessment models could eliminate the need for subjective input from lending officers. It is important to clarify, however, that subjectivity does not always translate to bias or unfairness in lending decisions. Lending officers, for instance, may rely on qualitative assessments of business metrics using their knowledge of prevailing industry issues or any rumors affecting certain firms’ business reputation. Subjective decisions become dubious and concerning when credit decisions are influenced by lending officers’ aversion to certain types of borrowers, with the bias linked to the borrowers’ innate attributes (such as race/ethnicity and gender) that are not predictors of business potential, survival, and success.
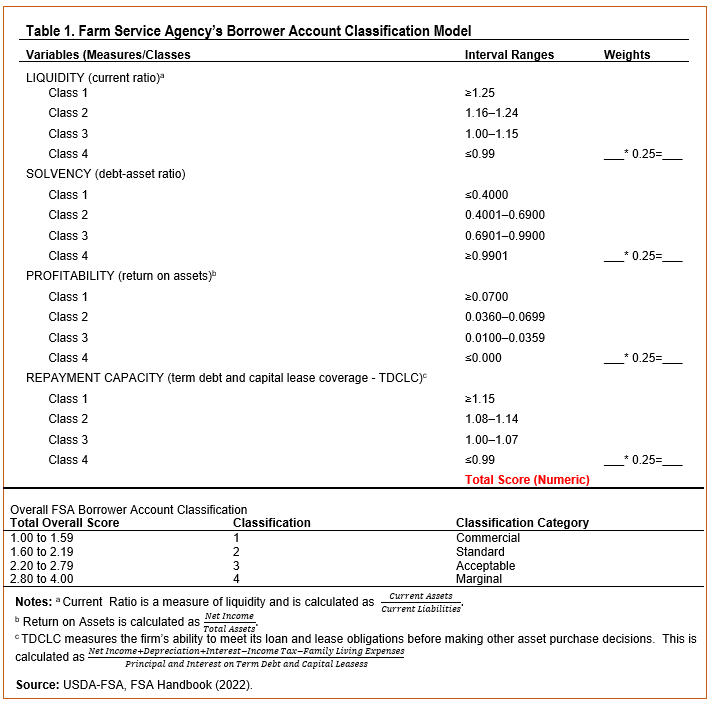
The FSA subscribes to the objectification principle through its FBC model, which structurally resembles a typical regular lender’s credit (risk assessment) scoring model (Splett, et al., 1994). An overall “credit classification” score is calculated for each borrower based on separate weighted scores assessed for selected financial indicators capturing a firm’s liquidity, solvency, profitability, and repayment capacity conditions. The overall score is used to categorize borrowers under four categories that serve as guide to FSA’s loan decisions. FSA’s actual classification scheme has five classes, with the fifth category for unclassified borrowers. In this analysis, we focus on the first four categories, which provide a more relatively meaningful assessment of borrowers’ creditworthiness.
As laid out in Table 1, the most favorable borrower classification is Category 1 (“Commercial”), as these are borrowers with the “best potential to obtain commercial credit.” In contrast, borrowers classified as Category 4 are considered Marginal. These are borrowers with loanapplications that could possibly be denied or, if grantedsome credit accommodation, might require more vigilant loan monitoring schemes, in addition to careful packaging of loan terms commensurate to perceived borrowers’ risk profiles.
There are striking deviations notable in the FSA FBC model when compared with a regular commercial lender’s prototype credit scoring model for term loan accounts (Splett et al., 1994). This commercial banking model is a combination of experiential and statistical inputs compiled from agricultural lenders in a workshop held in 1993 (Splett et al, 1994). Although individual commercial banks develop their own systems to calculate credit risk assessment scores, this model is considered representative of commercial banking scoring schemes and has been used in numerous empirical studies in agricultural finance.
The commercial banking model is a five-credit class model (while FSA only has four), considers a different financial measure for three of the four performance areas, and includes a financial efficiency measure as a fifth element. The rating classes within each financial performance category conform to universally accepted credit risk assessment standards, which are regarded as the norms in financial performance analyses.
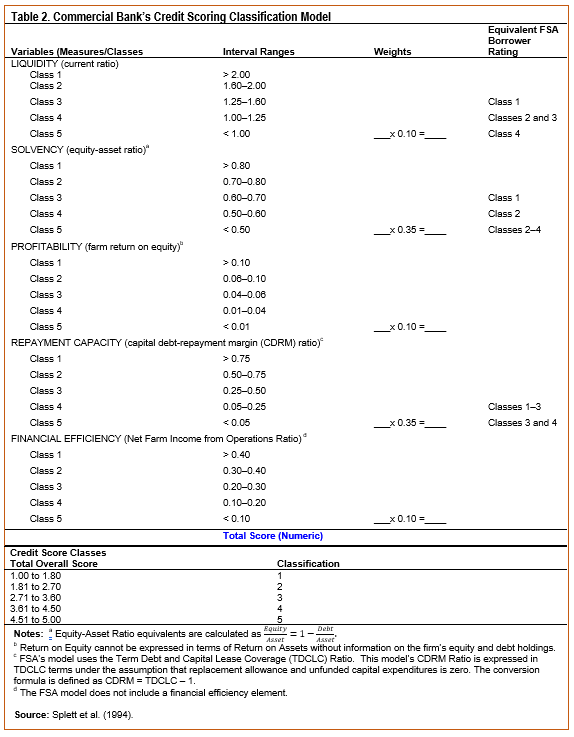
Table 2 presents the financial performance elements, their respective credit class intervals, and equivalent FSA borrower classifications for identical and equivalent financial ratios in both models. This latter comparison reveals a relatively marked leniency in FSA’s credit standards as its borrower classes are defined using lower cut-offs that more favorably rate certain borrowers who, when evaluated under the commercial banking model, would fall under lower credit classes. Specifically, the cut-offs for the liquidity measure (Current Ratio) are lower in the FSA model, where a ratio of 1.25 earns a Class 1 rating in the FSA model but would be assessed as Class 3 in the commercial banking model (since its Class 1 borrowers must have at least a 2.0 result).
In terms of solvency, the FSA model’s 0.40 debt-asset ratio threshold for Class 1 borrowers is equivalent to an equity-asset ratio of 0.60 in the commercial banking model. The equivalent of FSA’s debt-asset ratio in terms of the commercial bank’s equity-asset ratio is calculated as EquityAsset=1-DebtAsset. The latter model has a more stringent cut-off for Class 1 borrowers at 0.80 equity-asset ratio. The least favorable borrower classes require equity-asset ratios of at most 0.50 and 0.01 in the commercial bank and FSA models, respectively.
Important contrasts between the FSA borrower classification model and a typical commercial bank’s credit scoring classification model will be clarified using FSA national data of approved direct loans for 74,339 borrowers for the years 2004–2014. A second layer of our analyses features comparisons of relative financial strengths and weaknesses of borrower groups (using stand-alone race/ethnic and gender categories; and then combined racial/ethnic and gender labels) using borrowers’ overall and disaggregated (financial measure component-specific) FSA scores.
Table 3 presents the mean overall and disaggregated (into component financial measures) FSA borrower classification scores for the race/ethnicity and gender classes of borrowers. The statistical significance of differences between pairs of calculated scores for the reference borrower group (White borrowers) and each borrower category are highlighted in colored fonts in the table.
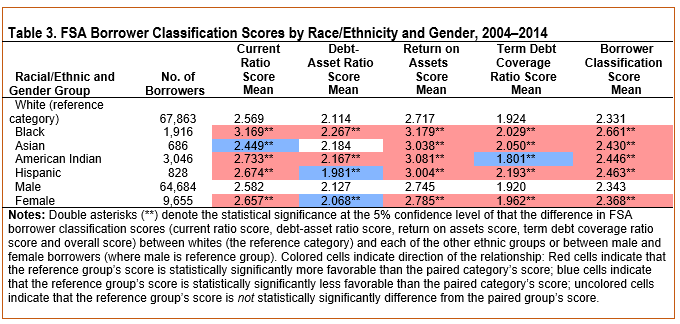
Trends in scoring results provide compelling evidence on White borrowers’ consistently dominant overall scores compared to all non-White borrowers’ scores. When the overall score is disaggregated into its component financial measures, White borrowers’ separate scores are consistently better than Black borrowers’ scores for all four financial measure components. Other racial/ethnic groups produce at least better scores than White borrowers in different financial measures: current ratio (Asian Americans), debt-asset ratio (Hispanic Americans), and term debt coverage ratio (American Indians).
Moreover, male borrowers on average receive significantly better overall scores than their female counterparts. Female borrowers outperform their male peers only in one financial measure (leverage).
Under categories that combine racial/ethnic and gender labels (Table 4), the results mirror the earlier trends. White males receive on average significantly more favorable overall scores than all the other borrower categories. Black males consistently produce significantly less favorable scores than the reference group in all four financial measure indicators. On a few occasions, certain combined categories significantly outperform the reference group’s results: debt-asset ratio (White females and Hispanic males) and term debt coverage ratio (White females and both gender groups of American Indians).
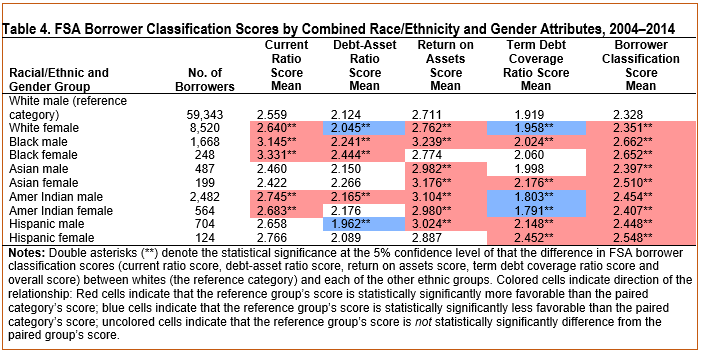
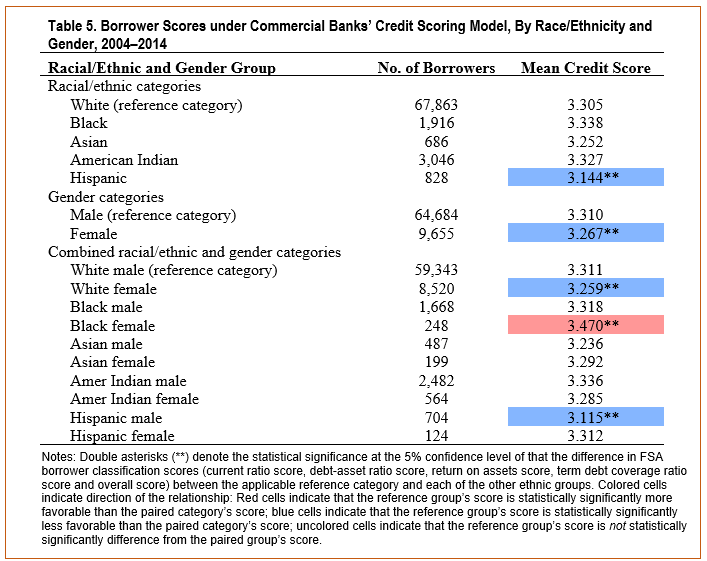
Table 5 presents the simulated FSA borrowers’ scores when the commercial banks’ credit scoring standards are applied. In general, the results validate that FSA borrowers in general indeed are “marginally average” under commercial banking credit standards as resulting mean scores for all borrower categories classify them as Class 3 borrowers. Commercial banks typically prioritize Classes 1 and 2 borrowers in their credit accommodation decisions, while Class 3 borrowers’ chances of obtaining credit are usually assessed with greater caution and under more protective credit risk management considerations.
Certain results in Table 5 provide some interesting departures from the trends noted in the FSA borrower classification application. White borrowers’ overall score is no longer consistently dominant across all racial/ethnic categories. They are now significantly higher (less favorable) than the Hispanic American borrowers’ mean overall score. The gender comparison reflects a reverse trend as female borrowers now fare better in the commercial banking model than their male peers. When
racial/ethnic and gender labels are combined, White female and Hispanic male borrowers receive significantly better mean scores than White male borrowers. The only consistent result from both the FSA and commercial bank scoring models is the White male borrowers’ score dominance over Black female borrowers.
Such disparities in the results from the two credit scoring models can be attributed to two factors: namely, the selection of the model’s financial variable components and the variables’ weighing schemes. Among other differences, financial efficiency is considered only in the commercial banks’ model while profitability measures emphasize different baselines. FSA employs an asset-based profitability measure while the commercial banks’ model uses an equity-based variable. These differing emphases could lead to contrasting effects on overall creditworthiness due to inherent disparities in structural business conditions and leveraging alternatives available to farmers of different racial/ethnic and gender attributes.
This article validates several crucial realities in the FSA’s direct lending programs. Indeed, FSA borrowers are usually assessed as “marginal borrowers” under regular lenders’ standards. These borrowers’ overall mean credit scores calculated under a typical commercial banking credit scoring model are consistently above 3.0, which is considered as the borderline separating preferred and marginal clients. The FSA aptly adjusts to the extent of leniency and adapts its credit scoring standards to the actual credit quality of its borrowers. Even under its more lenient credit scoring approach, FSA’s socially disadvantaged borrowers are usually less creditworthy than their White borrower peers. Under the commercial banks’ model, however, certain borrower groups tend to fare better (slightly higher “marginal” mean scores) than White borrowers owing to their model’s different choice of financial measures and variable weighting scheme.
These validations could help FSA consider modifications in its current borrower classification model. The regular banking model uncovers the relative strengths of some socially disadvantaged borrower groups under certain financial performance categories. Previous studies that compile comparative financial profiles of different FSA borrower categories identify the minority farms’ business strengths and vulnerabilities in several areas (Escalante et al., 2006; Escalante et al., 2018; Ghimire et al., 2020). For instance, minority-operated farms usually have better liquidity and solvency ratios than farms operated by their White peers (Escalante et al., 2006; Escalante et al., 2018; Ghimire et al., 2020). While these are positive business attributes, they possibly emanate from the minority farmers’ exposure to certain anomalies in the credit and input markets. When socially disadvantaged farmers have limited access to suppliers’ credit and regular loans, then they are compelled to make constrained purchase decisions within their realistic means. Some farmers even develop loan aversion after several frustrating attempts to obtain credit (Jones, Escalante, and Rusiana, 2015).
Lower levels of short-term trade and non-current liabilities may produce more favorable liquidity and solvency ratios, but these positive indicators are realized at the expense of diminished business growth potentials. Empirical evidence confirms that minority farmers’ businesses are usually significantly smaller in size in terms of both acreage and asset endowment. These conditions are even more aggravated by the inferior quality of their farm business assets. Less productive assets result in lower asset turnover ratios. Hence, these farms’ business expansion potentials and access to more productive assets could be constrained by inequities in the credit and asset markets.
Moreover, minority farm operations are usually significantly less profitable than those operated by White farmers. Among other factors, the profit-generating capacity of minority farmers’ businesses can be attributed to their inability to command better prices for their outputs. These farmers’ experiences of price discrimination in commodity markets can either be provoked by either product quality considerations or plain consumer stereotyping and prejudicial purchasing behavior.
Given these considerations, the FSA must consider a reevaluation of its model through a more deliberate, considerate selection of representative financial measures that emphasize borrowers’ relative financial strengths. Moreover, as Splett et al. (1994) demonstrated, a more reliable weighting scheme for the model’s financial performance categories may be determined from experiential and statistical techniques. A modified weighting scheme should assign more weight to minority farmers’ areas of financial strength (such as liquidity and solvency). These modeling modifications should be aimed at harnessing its borrowers’ true creditworthiness potential, especially the socially disadvantaged. The overriding goal of this suggested amendment is to increase the chances of minority farmers’ success in obtaining credit, which certainly could have a “trickle down” effect on the farms’ business survival and viability efforts. Specifically, the availability of external funds could create several business possibilities for these farms: propel their farms to further growth, afford more productive assets, and improve production and delivery mechanisms that create profit generation opportunities.
Policy efforts aimed at assisting more vulnerable socially disadvantaged farmers must realize that even unbiased, objectified lending decisions could not resolve these farmers’ credit access and business viability concerns. After all, as earlier argued, credit inequities are not the only deterrent factor to minority farmers’ business survival and success. The eradication of credit access constraints must be accompanied by a more integrated, comprehensive drive to address inequities in other fronts (among others, input, asset and product markets, government subsidy distribution, and access to technical support). Only then will these farmers be able to operate businesses that can compete well with their peers on all fronts, including their claims to an FSA credit accommodation.
Escalante, C.L., R. Brooks, J.E. Epperson, and F.E. Stegelin. 2006. “Credit Risk Assessment and Racial Minority Lending at the Farm Service Agency.” Journal of Agricultural and Applied Economics 38(1):61–75.
Escalante, C.L., J.E. Epperson, and U. Ragunathan. 2009. “Gender Bias Claims in Farm Service Agency’s Lending Decisions.” Journal of Agricultural and Resource Economics 34(2):332–349.
Escalante, C.L., A. Osinubi, C. Dodson, and C.E. Taylor. 2018. “Looking Beyond Farm Loan Approval Decisions: Loan Pricing and Non-Pricing Terms for Socially Disadvantaged Farm Borrowers.” Journal of Agricultural and Applied Economics 50(1):129–148.
Feder, J., and T. Cowan. 2013. Garcia v. Vilsack: A Policy and Legal Analysis of a USDA Discrimination Case. Congressional Research Service Report for Congress R40988.
Ghimire, J., C.L. Escalante, R. Ghimire, and C. Dodson. 2020. “Do Farm Service Agency Borrowers’ Double Minority Labels Lead to More Unfavorable Loan Packaging Terms?” Agricultural Finance Review 80(5):633–646.
Jones, G., C.L. Escalante, and H. Rusiana. 2015. “Reconciling Information Gaps in Organic Farm Borrowers' Dealings with Farm Lenders.” Agricultural Finance Review 75(4):469–483.
Koenig, S., and C. Dodson. 1999. “FSA Credit Programs Target Minority Farmers.” Agricultural Outlook 266:14–16.
May, C. 2012, September 25. “Obama USDA Offering Women, Hispanic Farmers over $1.3 Billion in Discrimination Payouts.” Daily Caller. Available online: http://dailycaller.com/2012/09/25/obama-usda-offering-women-hispanic-farmers-over-1-3-billion-in-discrimination-payouts/
Miller, L.H., and E.L. LaDue. 1989. “Credit Assessment Models for Farm Borrowers: A Logit Analysis.” Agricultural Finance Review 49:22–36.
Splett, N.S., P.J. Barry, B.L. Dixon, and P.N. Ellinger. 1994. “A Joint Experience and Statistical Approach to Credit Scoring.” Agricultural Finance Review 54:39–54.
The White House. 2000. Affirmative Action Review. Office of the President and the First Lady. Available online: https://web.archive.org/web/20170216162324/https://clinton4.nara.gov/WH/EOP/OP/html/aa/aa11.html [Accessed March 4, 2016].
Turvey, C.G. 1991. “Credit Scoring for Agricultural Loans: A Review with Applications.” Agricultural Finance Review 51:43–54.
Turvey, C.G., and A. Weersink. 1997. “Credit Risk and the Demand for Agricultural Loans.” Canadian Journal of Agricultural Economics 45(3):201–217.
U.S. Department of Agriculture Farm Service Agency (USDA-FSA). 2001. Creditworthiness Determinations, FLP-190. Available online: https://www.fsa.usda.gov/Internet/FSA_Notice/flp_190.pdf. [Accessed March 4, 2016].
———. 2022. “Borrower Account Classification.” In FSA Handbook: General Program Administration. 1-FLP (Rev. 1) Amend. 229, pp. 8-101 to 8-105.

