In 2018, Canada, China, the European Union, India, Mexico, and Turkey implemented retaliatory tariffs on many products, including almost all U.S. agricultural exports (Hopkinson 2018). U.S. agricultural exports targeted for retaliation were valued at $29.7 billion in 2017, with individual product lines experiencing tariff increases of 5%–140% (Regmi, 2019). Retaliatory tariffs reduced the value and volume of U.S. agricultural exports (Carter and Steinbach, 2020; Grant et al., 2021) with estimated annualized losses of $13.5–$18.7 billion (Grant et al., 2021). Trade losses were primarily concentrated in the Midwest, with Iowa, Illinois, and Kansas experiencing the highest losses (Morgan et al., 2022); tariffs were associated with declines in U.S. farm income of 16% in 2018 (Regmi, 2019). To mitigate the effects of retaliatory tariffs on U.S. farmers, the U.S. Department of Agriculture (USDA) developed a trade aid package comprised of three main parts: (i) the Market Facilitation Program (MFP) to provide direct payments to farmers; (ii) the Food Purchase and Distribution Program (FPDP) to purchase commodities targeted by tariffs and distribute them through nutrition assistance programs; and (iii) the Agricultural Trade Promotion Program (ATP), which develops alternative foreign markets for U.S. commodities (Schnepf, 2019).
While the MFP intended to provide relief from retaliatory tariffs, some studies have found that MFP payments were not equitably distributed according to the severity of trade damages (Janzen and Hendricks, 2020; Adjemian, Smith, and He, 2021; GAO, 2021; Choi and Lim, 2023). For example, Janzen and Hendricks (2020) find that payments for some commodities exceeded estimated price impacts (e.g., cotton, sorghum), while payments initially appeared to undercompensate other commodities (e.g., corn) relative to price impacts. Further, total payments were primarily destined toward large operations instead of smaller farms (GAO, 2022). In 2022, the U.S. Government Accountability Office (GAO) examined the distribution of MFP payments and found that historically underserved farmers received 3.6% of payments. In addition, Hendricks et al. (2024)examined the distribution of payments that farms were eligible to receive by producer race, based on the formulas used to calculate MFP payments using 2017 Census of Agriculture data. The authors find that differences in payments among White and Black farm operators can be largely attributed to differences in farm size.
Building on previous research related to the distribution of MFP and the concerns about disparities in government payments (GAO, 2021, 2022; Hendricks et al., 2024), this article analyzes reported MFP payments using the USDA Agricultural Resource Management Survey (ARMS) Phase III dataset from 2018–2020. Hendricks et al. (2024) uses estimated receipts using the MFP formulas and reported crop production from the 2017 Census of Agriculture, while our analysis uses ARMS data that provides information on farmers’ self-reported MFP receipts. Additionally, we summarize payments by race and ethnicity, sex, and farming status (beginning farmer and limited resource) to better understand how payments varied across different farmer characteristics. We find differences in reported payments across farmer characteristics (e.g., average payments to White-only farms were higher than those for any other minority-only farm for all years in the dataset). These differences are potentially driven by several factors, including farm size and specialization.

The MFP provided two rounds of payments to farmers, with payments totaling $8.6 billion in 2018 and $14.4 billion in 2019 (GAO, 2022). In 2018, MFP payments were allocated using a crop-specific rate and the payment formula was based on actual production values. The payments were intended for producers of specific commodities that were significantly affected by retaliatory tariffs, including cotton, corn, sorghum, soybeans, wheat, dairy, and hogs (Paulson, Featherstone, and Hadrich, 2020). In contrast, MFP payments in 2019 were estimated using a county payment rate, and the payment formula was based on acres planted of eligible crops instead of actual production values. The 2019 MFP payments expanded the number of commodities eligible for payment (from 9 to 41) to include more nonspecialty and specialty crops, increased the payment limits, and had higher payment rates per acre (Schnepf, 2019; Schnitkey et al., 2019).
To qualify for a market facilitation payment, individuals had to have ownership interest in the commodity, have an USDA-FAS farm number, and comply with wetland conservation regulations. In addition, operators needed to have an average adjusted gross income (AGI) of less than $900,000 in 2013, 2014, and 2015 to quality for MFP 2018 (USDA, 2019). Last, farmers received payments in tranches, with some MFP 2018 payments disbursed in 2019 and MFP 2019 payments disbursed in 2020. As such, we include data on reported MFP payments for 2018, 2019, and 2020.

The ARMS is a three-phase survey jointly conducted by the USDA’s National Agricultural Statistics Survey (NASS) and the Economic Research Service (ERS). Phase I of the survey is the screening phase, used to collect general farm data such as the types of crops grown and livestock inventory. Phase II collects data on production practices and costs for specific commodities. Phase III collects data on operator characteristics, farm household information, government payments, and farm finance data (U.S. Department of Agriculture-NASS, 2024).
In this study, we rely on the ARMS Phase III survey from 2018–2020 for information on farm operators and reported MFP payments. ARMS collects information on up to four operators per farm, and we use the race/ethnicity and sex of each operator to classify farms. In this context, a White-only farm refers to a farm in which all operators are White. Similarly, a Black-, Asian-, and American Indian or Alaska Native-only farm has operators of only the corresponding race. These race and ethnicity categorizations are not mutually exclusive, as some operators identify as multiracial. For example, if a farm with a single operator identifies as Black and Asian, the farm would be classified as both a Black-only and Asian-only farm. If the farm has multiple operators including a mixed-race operator, the farm would be classified as a certain type if the race of other operators matches one of the races of a mixed-race operator. For example, if a farm has two operators, one who identifies as Black and Asian and another who identifies as Black, the farm would be counted as Black-only. Similarly, the Hispanic-only categorization refers a farm in which all operators identify as Hispanic, irrespective of their race. For example, a Hispanic-only farm could have operators who identify as Hispanic-White and Hispanic-Black. Approximately, 91%–95% of farms have White-only operators; in contrast, 1.20%–1.60% of farms have Black-only operators. This percentage declined slightly between 2018 and 2020.
A limited resource (LR) farm is defined as having gross farm sales under $180,300 (2020 dollars) and whose principal operator’s total household income was below the poverty level for a family of four or less than half of the county median income for 2 consecutive years (Todd et al., 2024). Approximately 8%–10% of farms qualify as limited resource for each year of the data. Finally, beginning farms are operated by producers who have no more than 10 years of farming experience, and this group makes up 16%–20% of farms in the data (Table 1).
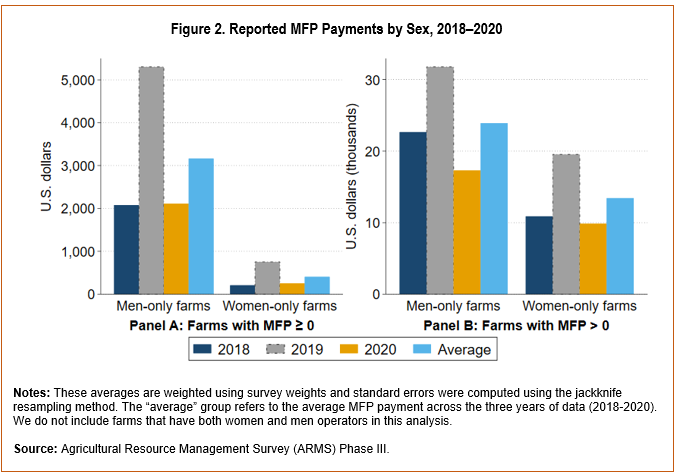
Figure 1 shows the reported average payments that farms received, including those that received zero payments, for each race and ethnicity across the 3 years of ARMS data. Because MFP payments had eligibility requirements, such as the production of certain commodities and an AGI threshold, some farms did not receive payment.
In 2018, farms with White-only operators received an average of $1,750 in MFP payments, 6.7 times more than farms with Black-only operators, which received $263 on average. In 2019 and 2020, payments for White-only farms are 7.5 and 4.6 times higher, respectively, than payments to Black-only farms (Figure 1). These differences in payment amount are comparable with Hendricks et al. (2024), who finds that farms with a White operator are eligible to receive payments 4.7 times higher than farms with a black operator.
Payments for farms with either only American Indian/Alaska Native operators or Asian operators were lower compared to those made to farms with only White operators and Black operators. American Indian/AlaskaNative-only farms reported average payments of $229 in
2018, $327 in 2019, and $34 in 2020, while Asian-only farms received $141 in 2018, $335 in 2019, and $827 in 2020. Last, farms with only Hispanic operators reported higher average MFP payments than Black-only, American Indian/Alaska Native-only, and Asian-only farms but had payments 1.4–2.9 times lower than White-only farms. We also note that, with the exception of
Asian-only farms, we see a peak in reported average MFP payments in 2019. This is likely due to some producers receiving both 2018 and 2019 payments during the 2019 calendar year as well as the expansion of crops covered for MFP payment. The deadline for applications for the second round of MFP payments was in December 2019 (U.S. Department of Agriculture, 2019).
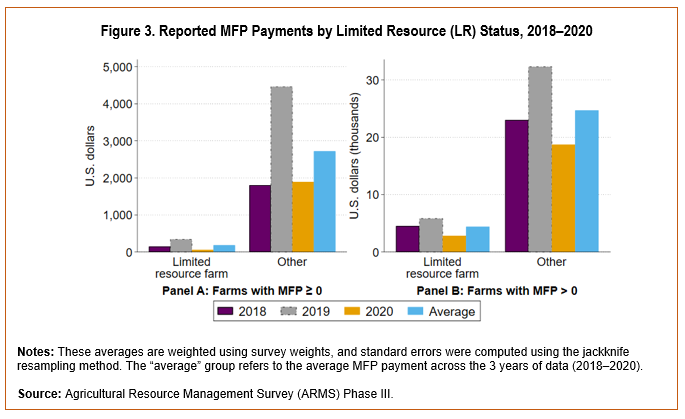
Figure 2 shows the reported average payment by men- and women-only farms for each year of the data. A women-only farm refers to a farm where all operators are women. Similarly, men-only farms refer to farms operated by men. We do not include farms that have both women and men operators in this analysis. Panel A includes all farms, including those that did not receive an MFP payment, while Panel B is the conditional reported payment by year.
Including farms that did not report a payment, men-only farms report payments 7–10 times higher than women-only farms. The difference is largest in 2018; men-only farms had an average payment of $2,079, while women-only farms report an average payment of $206, a payment 10 times smaller than that of men-only farms (Figure 2, Panel A). In contrast, when looking at positive MFP payments, the difference in payments between men- and women-only farms is much smaller. From 2018 to 2020, average payments of farms with only men operators were $17,280–$31,817, while women-operated farms reported payments of $9,846–$19,537 (Figure 2, Panel B). The disparity in payments is smallest in 2019, with payments to men-only farms 1.6 times larger than payments to women-only farms.
Limited resource (LR) farms had lower average MFP payments than non-LR farms. Figure 3, Panel A shows all farms, including those that did not receive an MFP payment, and the disparity between both groups is large. Compared with their LR counterparts, MFP payments to non-LR farms are 12 times higher in 2018, 13 times higher in 2019, and 33 times higher in 2020. Looking exclusively at positive MFP reported payments, the difference between these two groups is attenuated compared to the unconditional averages, with payments 5–6.5 times higher for farms not classified as limitedresource. In 2019, LR farms received an average MFP payment of $5,834, while the average payment to non-LR farms was $32,304.
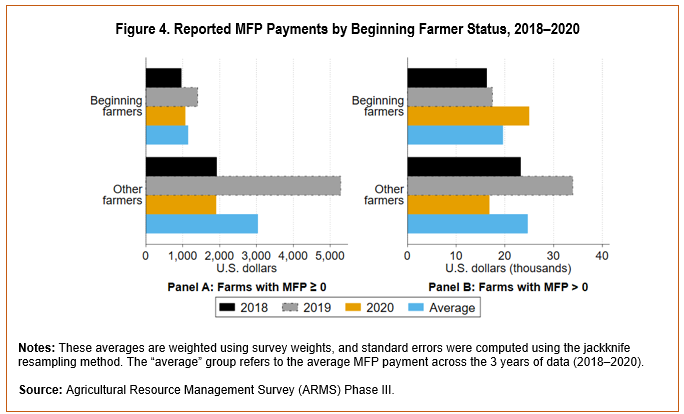
Finally, Figure 4 highlights the unconditional and conditional average payments to farms operated by beginning farmers. Overall, beginning farmers reported smaller MFP payments compared to more experienced farmers. Panel A shows a large difference across all 3 years of the dataset when including farmers who did not receive a payment in the average calculation. Similar to other groups, payments were highest in 2019. Panel B shows a smaller difference in conditional payments between beginner and non-beginner farmers. In both 2018 and 2019, payments to non-beginning farmers were higher. However, in 2020, farms operated by beginning farmers reported an average MFP payment of $24,979, 49% higher than the reported average payment to other farmers (Figure 4, Panel B).

Our descriptive analysis shows a similar result to Hendricks et al. (2024) in that there are differences in the size of MFP payments across racial groups in the ARMS data. While comparing mean reported payment receipts cannot identify the sources of these differences, in their analysis Hendricks et al. (2024) decomposed expected payments, finding that these differences can be attributed to farm size and the mix of crops produced.
Figure 5 presents the average harvested acres by race and ethnicity between 2018 and 2020. White-only farms on average harvested 162 acres in 2018, 157 acres in 2019, and 154 acres in 2020. Conversely, farms with only Black operators harvested 27–38 acres during the study period.
Similar to Black-only farms, Asian-, American Indian-, and Hispanic-only farms harvested fewer acres than White-only farms between 2018 and 2020. Harvested acres by Asian-only farms increased from 26 acres in 2018 to 80 acres in 2020, while Hispanic-only farms trended downward in the 3-year period, with average harvested acres of 42–83 acres.
While the payment formulas for MFP relied on production values in previous years or planted acres, the differences in harvested acres across racial groups in the ARMS survey suggests that White-only farms tend to be much larger than farms operated by minorities. The correlation coefficient between harvested acreage and reported MFP payments (ρ = 0.60) supports the theorized results in Hendricks et al. (2024) that farm size is an important factor in determining payment amount.
The MFP was an ad hoc program that supported farmers when retaliatorily tariffs affecting U.S. agricultural exports were imposed in 2018 and 2019. MFP payments varied across farms based on production levels, acreage, geography, and crop mix. Using ARMS survey data, this study evaluates differences in reported payments across diverse groups of farms and farmers including different racial and ethnic groups, farms operated by women only, LR farms, and farms operated by beginning farms.
Overall, farms with only White operators reported
receiving MFP payments 4.6–6.7 times higher than farms with only Black operators; similar differences existwhen focusing on farms with only Asian, American Indian/Alaska Native, or Hispanic producers. Like
Hendricks et al. (2024), we find evidence using the self-reported receipts that this difference in MFP payments may be driven in part by larger farm sizes among White farmers. We find a positive correlation between acreage and MFP payments in ARMS suggesting that as farm size increases, so do MFP payments. Throughout the sample period the average farm size is higher for White farms than other groups.
This article highlights the important differences in reported ad hoc support across several dimensions of diversity in U.S. farms and farmers. For example, women-only farms, limited resource operators, and beginning farmers all received lower levels of MFP payments compared with their counterparts. More research is needed to better understand the drivers of these disparities, the interaction of effects across different diverse groups, and how U.S. farms participate in and benefit from ad hoc support programs.
Adjemian, M.K., A. Smith, and W. He. 2021. “Estimating the Market Effect of a Trade War: The Case of Soybean Tariffs.” Food Policy 105:102152.
Carter, C., and S. Steinbach. 2020. “The Impact of Retaliatory Tariffs on Agricultural and Food Trade.” NBER Working Paper 27147.
Choi, J., and S. Lim. 2023. “Tariffs, agricultural subsidies, and the 2020 US presidential election.” American Journal of Agricultural Economics 105.4: 1149-1175.
Grant, J.H., S. Arita, C. Emlinger, R. Johansson, and C. Xie. 2021. “Agricultural Exports and Retaliatory Trade Actions: An Empirical Assessment of the 2018/2019 Trade Conflict.” Applied Economic Perspectives and Policy 43(2):619–640.
Hendricks, N.P., A.M. Murphy, S.N. Morgan, S.L. Padilla, and N. Key. 2024. “Explaining the Source of Racial Disparities in Market Facilitation Program Payments.” American Journal of Agricultural Economics, forthcoming.
Hopkinson, J. 2018. Profiles and Effects of Retaliatory Tariffs on U.S. Agricultural Exports. Congressional Research Service Report R45448.
Morgan, S., S. Arita, J. Beckman, S. Ahsan, D. Russell, P. Jarrell, and B. Kenner. 2022. The Economic Impacts of Retaliatory Tariffs on U.S. Agriculture. U.S. Department of Agriculture, Economic Research Service, Economic Research Report ERR-304.
Paulson, N.D., A.M. Featherstone, and J.C. Hadrich. 2020. “Distribution of Market Facilitation Program Payments and Their Financial Impact for Illinois, Kansas, and Minnesota Farms.” Applied Economic Perspectives and Policy 42(2):227–244.
Regmi, A. 2019. Retaliatory Tariffs and U.S. Agriculture. Congressional Research Service Report R45903.
Schnepf, R. 2019. Farm Policy: USDA’s 2019 Trade Aid Package. Congressional Research Service Report R45865.
Schnitkey, G., N. Paulson, K. Swanson, J. Coppess, and C. Zulauf. 2019. “The 2019 Market Facilitation Program.” Farmdoc Daily 9 (139).
Todd, J.E., C. Whitt, N. Key, and O. Mandalay. 2024. An Overview of Farms Operated by Socially Disadvantaged, Women, and Limited Resource Farmers and Ranchers in the United States. U.S. Department of Agriculture, Economic Research Service, Economic Information Bulletin EIB-266.
U.S. Department of Agriculture. 2019. “[Archived] Market Facilitation Program.” Available online: https://www.farmers.gov/archived/protection-recovery/mfp
U.S. Department of Agriculture, NASS. 2024. “Surveys” Available online: https://www.nass.usda.gov/Surveys/Guide_to_NASS_Surveys/Ag_Resource_Management/
U.S. Government Accountability Office. 2021. USDA Market Facilitation Program Stronger Adherence to Quality Guidelines Would Improve Future Economic Analyses. GAO-22-468.
———. 2022. USDA Market Facilitation Program: Oversight of Future Supplemental Assistance to Farmers Could Be Improved. GAO-22-104259.

