The USDA Equity Action Plan outlines several initiatives “to advance programmatic equity and improve access to programs and services for underserved stakeholders” (USDA, 2022). Unfortunately, only limited data are available about USDA program access to help guide these efforts. Analyses of differences in program use across demographic groups often rely on USDA administrative data that only include information on program participants rather than the full farm population (e.g., Giri, Subedi, and Kassel, 2022; Yu and Lim, 2024). As we describe below, data that only include program participants can mask important discrepancies across groups in access to agricultural programs and services.
To help provide context for discussions about program equity and access, we use U.S. Census of Agriculture data to compare participation in and use of agricultural programs and credit markets by farms with Black, American Indian, Asian, and Hispanic principal operators to farms with only non-Hispanic white principal operators. The data show that among program participants, farms with American Indian, Asian, Hispanic and non-Hispanic white principal operators receive, on average, similar levels of program payments and have similar amount of crop insurance coverage. In contrast, among the entire farm population, program receipts and insurance coverage for these groups are generally well below the levels for non-Hispanic white farms. These population-level discrepancies can be largely explained by the fact that Black, American Indian, Asian, and Hispanic farms all have lower participation rates than non-Hispanic white farms for all the programs for which data are available.
The important role of participation rates in explaining variation in average program use across demographic groups suggests that equity in program outcomes could be improved by reducing barriers to participation.
The Census of Agriculture, which is administered by the USDA National Agricultural Statistics Service (NASS), aims to collect information from all farms—that is, all agricultural operations that produce, or would normally produce and sell, at least $1,000 of agricultural products per year. NASS allows eligible researchers to access the microdata files used in this study for select statistical research projects (USDA-NASS, 2024). The census collects information about the operation and up to four operators. In 2017, respondents were asked to indicate whether each operator is a “principal operator or senior partner.” The NASS Report Form Guide defines the principal operator as “either the person regarded by the other operators as the one making the majority of the decisions or the oldest operator.”
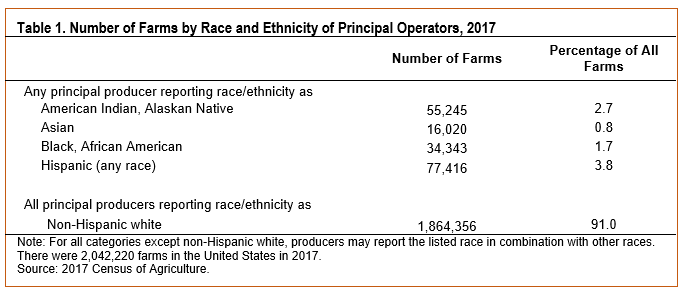
We use data from the 2017 Census to compare program use and borrowing across groups of farms classified according to the demographic characteristics of the principal operators (Table 1). For brevity, we refer to a farm as: (i) “Black” if any principal producer reports being Black or African American; (ii) “American Indian” if any principal producer reports being American Indian or Alaskan Native; (iii) “Asian” if any principal producer reports being Asian; (iv) “Hispanic” if any principal producer reports being Hispanic. We also create a “Non-Hispanic white (NHW)” group, defined as farms on which all principal producers report being only non-Hispanic and white.
Payments received from federal and state agricultural programs provide a measure of program use. In 2017, conservations programs, which help farmers adopt practices that protect natural resources, included payments from the Conservation Reserve, Wetlands Reserve, Farmable Wetlands, and Conservation Reserve Enhancement programs. Other USDA programs help mitigate the risks of farming or help farmers recover from losses due to natural disasters. In 2017, “other federal” payments came almost entirely from the Agriculture Risk Coverage and Price Loss Coverage (ARC/PLC) programs and from supplemental and ad hoc disaster assistance programs (USDA-ERS, 2023).
The Census of Agriculture does not collect data on crop insurance premiums, but insurance coverage can be measured using (i) acres in the operation covered under a crop insurance policy, and (ii) total crop and livestock insurance payments (indemnities) received. Acres insured is an imperfect measure of the level of coverage since the value of production insured per acre can differ significantly depending on the type of commodities produced and on yields. Hence, indemnity payments may provide a better measure of coverage with which to compare groups, although only a fraction of farms with insurance receive these payments in any year.
Credit use is measured by the amount of interest paid on farm-related debt. The census distinguishes between debt secured by real estate (typically long-term loans to purchase farmland) and debt not secured by real estate (usually short- or medium-term loans for seed, fertilizer, breeding stock, machinery, or other inputs or investments). Interest expenses reflect loans from both government and private lenders. In 2017, about half of real estate secured loans and about a third of non-real estate secured loans were obtained from the Farm Credit System, Farm Service Agency, or indirectly through Farmer Mac (USDA-ERS, 2023). The remainder of the farm debt was obtained from commercial banks, life insurance companies, storage facility loans, individuals, or other sources. In 2017, loans from the USDA Farm Service Agency, which operates loan programs that target historically underserved farmers, represented less than 3% of both real estate and non-real estate secured debt (USDA-ERS, 2023).

Among program participants, differences between NHW and American Indian, Asian, and Hispanic farms are relatively small for most measures of program use (Table 2). For example, American Indian, Asian, and Hispanic farms received 89%, 102%, and 103% the level of total agricultural program payments, and 81%, 104%, and 107% of the level of crop insurance indemnities received by NHW farms, respectively. The discrepancies in acres insured were larger, but this might be caused by differences in commodity mix rather than differences in value of the commodities insured.
In contrast to the other groups, Black farms that participated in programs had substantially lower average levels of program use than NHW farms. Among program participants, Black farms received only about half of the total program payments received by NHW farms and about half the level of insurance indemnities.
There was substantial variation across the groups in terms of interest expenses, suggesting different levels of debt. Among farms with debt, American Indian and Black farms had interest expenses that were 59% and 38% as high as NHW farms, respectively. Hispanic farms had interest expenses that were very similar to NHW farms. Asian operations had almost twice the level of interest expenses as NHW farms.

Table 3 shows the average levels of program use and interest expenses for the full population (participants and nonparticipants) where nonparticipants are assigned a zero level of payments, acres, insured, indemnity payments, or interest expenses. The average differences between NHW farms and the other groups are generally much larger than they were among participants only. For example, farms with an American Indian, Asian, or Hispanic principal operator received, on average, only about a third of the amount of agricultural program payments as NHW farms. American Indian, Asian, and Hispanic farms received between 30% and 56% as many crop insurance indemnity payments as NHW farms.
The substantial gap in program use and interest expenses between NHW farms and Black farms that was observed among participants was even larger for the full farm population. On average, Black farms received only a third of the level of program payments as NHW farms and only a quarter of the indemnity payments.
For the full population, all the demographic groups except Asian farms had lower average interest expense levels than NHW farms. Total interest expenses for Black farms were about a quarter the level of NHW farms. American Indian and Hispanic farms had total interest expenses: 43% and 74% the level of NHW farms, respectively.
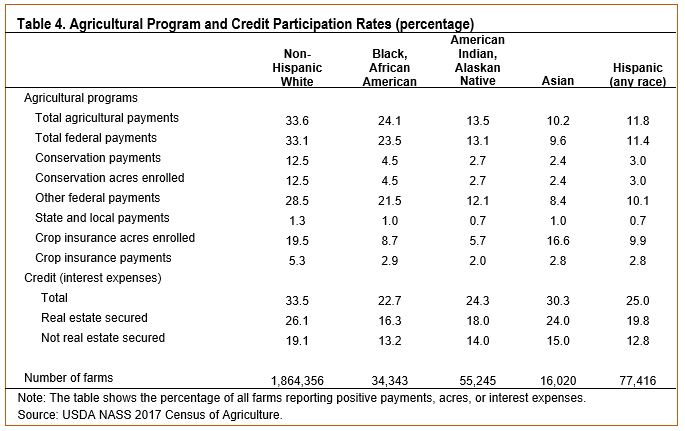
Discrepancies in participation rates explain much of the population-level differences in program use between the demographic groups. NHW farms were two to three times more likely to receive any program payments than were American Indian, Asian, or Hispanic farms (Table 4). The differences were even greater for conservation programs, for which NHW farms were four to five times more likely to enroll acres or receive any payments. Participation rate differences between NHW and Black farms were also substantial, although not as large as between NHW farms and the other groups. NHW farms were about 40% more likely to receive any program payments than Black farms. For crop insurance indemnities, NHW farms were two to three times as likely to receive indemnity payments than all the other demographic groups.
NHW farms were substantially more likely to have some farm business debt than Black, American Indian, or Hispanic farms. For example, about a third of NHW farms had some interest expenses, compared to less than a quarter of Black, American Indian, or Hispanic farms. Asian farms had a similar likelihood of having debt as NHW farms.
There are many possible reasons why the use of agricultural programs and credit varies across demographic groups. Farmers in different demographic groups tend to be concentrated in different regions with
dissimilar climates and soils (Todd et al., 2024). Variation across groups in the quantity and quality of land and productive assets they control helps determine the amount and mix of commodities produced and, consequently, the level of agricultural program use and borrowing (Hendricks et al., 2024). This link between farm size, commodity mix, and program benefits results largely from the way programs are designed. For example, the Agriculture Risk Coverage (ARC) and Price Loss Coverage (PLC) programs allocate payments according to a farm’s base acres—farmland that was historically cultivated in certain field crops. For some conservation programs, payments depend on the acreage that a farm removes from production. For farms with crop insurance, potential indemnity payments increase with the number of acres enrolled.
Differences in commodity mix and farm size may also help explain variation in program and credit market participation rates. The net benefits to participating in a program or borrowing may be greater for larger-scale operations, causing farm size to be positively correlated with participation rates. The decision to borrow may also be influenced by the legal structure of land ownership. For example, “heirs’ property,” where multiple individuals have legal claim to the land, can make it more difficult for individuals to secure loans and coordinate the use of the land (Deaton, 2012). Such joint ownership arrangements are disproportionately common on African American-owned farms. Farmland held in trust by the federal government on American Indian reservations may also have significant restrictions on its use and development, which can hinder agricultural production and program participation (Leonard, Parker, and Anderson, 2020).
Differences in awareness of agricultural programs, attitudes toward programs, or language barriers might also cause variations in program participation rates across demographic groups. Asare-Baah, Zabawa, and Findlay (2018) found that lower participation rates among African American farmers could be explained, in part, by some farmers believing they would not qualify for a program or loan. Other researchers found that participation by Black farmers in agricultural programs was restricted by lack of program awareness and inadequate understanding of program rules and regulations (Hargrove and Jones, 2004). Minkoff-Zern and Sloat (2017) found that low participation rates in USDA programs by Latino immigrant farmers stemmed partly from their discomfort and distrust of government bureaucracy and from relatively limited English literacy skills, which made it more difficult to complete required paperwork. Kalo and Teigen de Master (2016) also described how the complexity of paperwork made the application process for USDA programs challenging for non-English speakers.
The use of credit might be lower for some demographic groups because of real or anticipated unequal treatment by lenders. In the 1990s and 2000s, several civil rights lawsuits were filed against the USDA Farm Service Agency (FSA). Budgets for the settlements of these cases included more than $2 billion for African American farmers, $680 million for Native American farmers, and $1.33 billion for Hispanic and women farmers (Feder and Cowan, 2013). Since these suits were settled, the USDA has enacted reforms designed to improve access to loans. The extent of ongoing racial discrimination in federal lending is an area of on-going research (e.g., Escalante et al., 2018; Dhakal, Escalante, and Dodson, 2019; Ghimire et al., 2020; Mishra, Short, and Dodson, 2024). In contrast, there have been few analyses of discrimination in private sector agricultural lending, mainly because regulations prohibit lenders from collecting personal characteristics data on loans, except for mortgage loans (U.S. GAO, 2019). However, advocacy groups reported to the Government Accountability Office (GAO) that some farmers from historically underserved groups have been dissuaded from applying for credit because of past instances of alleged discrimination.
The Census of Agriculture data show that among program participants, non-Hispanic white (NHW), American Indian, Asian, and Hispanic farms used many agricultural programs at roughly the same average levels. In contrast, across the full farm population, American Indian, Asian, and Hispanic farms had substantially lower average levels of program use than NHW farms. These population-level gaps, which are often not revealed by administrative data, can be explained mainly by lower program participation rates.
Farms with Black principal operators are distinct from the other demographic groups, in that they had lower average levels of program use than NHW farms both among program participants and all farms. However, as with the other groups, the population-level discrepancies were larger for the full farm population because Black farms had lower program participation rates than NHW farms.
In terms of debt, both Black and American Indian farms had substantially lower average levels of interest expenses than the other demographic groups. Black and American Indian farms were less likely to have any debt, and those that borrowed had lower interest expenses (suggesting they took smaller loans, on average). While Hispanic and NHW borrowers had similar levels of interest expenses, the average interest expense for all Hispanic farms was substantially lower than the average for NHW farms, reflecting the smaller share of Hispanic farms having any debt.
The results illustrate the importance of program participation rates in explaining population average differences in program use across demographic groups. Discrepancies in program participation may be partly explained by differences in farm size and commodity mix, which in turn determine program eligibility and influence farmers’ incentives to enroll in programs. Many existing programs benefit primarily large-scale field crop producers located disproportionately in the Midwest and Plains regions (McFadden and Hoppe, 2017). For example, ARC and PLC program payments are only available for 22 field crops and are allocated mainly to producers of corn, wheat, soybean, sorghum, cotton, barley, oats, and rice (USDA-FSA, 2022). Program participation gaps might be reduced by making it easier for smaller operations to enroll in programs or by expanding program eligibility. For example, in recent years, the USDA Risk Management Agency (RMA) has enacted a series of policy changes to expand crop insurance use by specialty crop producers. To encourage enrollment by smaller-scale operations, the RMA has streamlined its application and claims processes and now allows specialty crop producers to use their own records to meet crop insurance reporting requirements (FCIC, 2022).
Other potential barriers to program participation include joint land ownership arrangements, challenges with English literacy, and limited computer skills. Lower participation rates could stem from little local availability of USDA program offices or extension services, producers’ being unaware of programs, or not understanding program rules and regulations. Attitudes or preferences toward participating in programs may vary across groups according to real or perceived differences in the costs of applying for programs or the likelihood of receiving program benefits. It is also possible that farmers are treated differently while applying for programs or loans or in how their applications are evaluated.
A better understanding of the factors affecting farmers’ decision to apply for loans and agricultural programs could help policy makers and program administrators increase participation rates and population-level program use rates for underrepresented groups. The Census of Agriculture, which includes information on both program participants and nonparticipants, allowed us to measure the rates of program uptake and borrowing among all farms. Future research using data from the census or another representative survey, such as the USDA Agricultural Resource Management Survey, could explore the causes of disparities between groups. It should be feasible to quantify the extent to which differences in program use and participation rates can be attributed to variation in farm size, commodity mix,
location, and other observed farm characteristics. If only administrative data on program participants are available, then statistical analyses using this group may need to account for possible biases that could arise when program participants differ from nonparticipants in ways that cannot be observed (Neuman and Oaxaca, 2004).
A more complete understanding of the reasons for differences in farm programs and credit market access will require better information about the challenges faced by farmers. Such information could be obtained by expanding surveys of the farm population to include questions about land ownership arrangements, proximity to USDA offices, the use of extension services, operators’ training and educational attainment, knowledge of available programs, and farmers’ opinions about the barriers they face in applying for and participating in farm and credit programs.
Asare-Baah, L., R. Zabawa, and H. Findlay. 2018. “Participation in Selected USDA Programs by Socially Disadvantaged Farmers in Selected Black Belt Counties in Georgia.” Journal of Rural Social Sciences 33(1):2.
Deaton, B.J., 2012. “A Review and Assessment of the Heirs' Property Issue in the United States.” Journal of Economic Issues 46(3):615–632.
Dhakal, C.K., C.L. Escalante, and C. Dodson. 2019. “Heterogeneity of Farm Loan Packaging Term Decisions: A Finite Mixture Approach.” Applied Economics Letters 26(18):1528–1532.
Escalante, C.L., A. Osinubi, C. Dodson, and C.E. Taylor. 2018. “Looking Beyond Farm Loan Approval Decisions: Loan Pricing and Nonpricing Terms for Socially Disadvantaged Farm Borrowers.” Journal of Agricultural and Applied Economics 50(1):129–148.
Federal Crop Insurance Corporation (FCIC). 2022. Specialty Crops Report 2022. U.S. Department of Agriculture, Risk Management Agency. Available online: https://www.rma.usda.gov/en/Topics/Specialty-Crops [Accessed September 2023].
Feder, J., and T. Cowan. 2013. Garcia v. Vilsack: A Policy and Legal Analysis of a USDA Discrimination Case. Congressional Research Service Report for Congress R40988.
Ghimire, J., C.L. Escalante, R. Ghimire, and C.B. Dodson. 2020. “Do Farm Service Agency Borrowers’ Double Minority Labels Lead to More Unfavorable Loan Packaging Terms?” Agricultural Finance Review 80(5):633–646.
Giri, A.K., D. Subedi, and K. Kassel. 2022. “Analysis of the Payments from the Coronavirus Food Assistance Program and the Market Facilitation Program to Minority Producers.” Applied Economic Perspectives and Policy 46(1):189–201.
Hargrove, T., and B.L. Jones. 2004. “A Qualitative Case Study Analysis of the Small Farmers Outreach Training and Technical Assistance (2501) Program from 1994-2001: Implications for African American Farmers.” Journal of Agricultural Education 45(2):72–82.
Hendricks, N., Murphy, A., Morgan, S., Padilla, S., and N. Key. “Explaining the Source of Racial Disparities in Market Facilitation Program (MFP) Payments.” American Journal of Agricultural Economics, forthcoming.
Kalo, A., and K. Teigen de Master. 2016. “After the Incubator: Factors Impeding Land Access along the Path from Farmworker to Proprietor.” Journal of Agriculture, Food Systems, and Community Development 6(2):111–127.
Leonard, B., D.P. Parker, and T.L. Anderson. 2020. “Land Quality, Land Rights, and Indigenous Poverty.” Journal of Development Economics 143:102435.
McFadden, J.R. and R.A. Hoppe. 2017. The Evolving Distribution of Payments from Commodity, Conservation, and Federal Crop Insurance Programs. U.S. Department of Agriculture, Economic Research Service, Economic Information Bulletin EIB-184.
Minkoff-Zern, L., and S. Sloat. 2017. “A New Era of Civil Rights? Latino Immigrant Farmers and Exclusion at the United States Department of Agriculture.” Agriculture and Human Values 34: 631–643.
Mishra, A.K., G. Short, and C.B. Dodson. 2024. “Racial Disparities in Farm Loan Application Processing: Are Black Farmers Disadvantaged?” Applied Economic Perspectives and Policy 46(1):111–136.
Neuman, S., and R.L. Oaxaca. 2004. “Wage Decompositions with Selectivity-Corrected Wage Equations: A Methodological Note.” Journal of Economic Inequality 2:3–10.
Todd, J., C. Whitt, N. Key, and O. Mandalay. 2024. An Overview of Farms Operated by Socially Disadvantaged, Women, and Limited Resource Farmers and Ranchers in the United States. U.S. Department of Agriculture, Economic Research Service, Economic Information Bulletin EIB-266.
Yu, J., and S. Lim. 2024. “Understanding Inequality in US Farm Subsidies Using Large-Scale Administrative Data.” American Journal of Agricultural Economics, forthcoming.
U.S. Department of Agriculture (USDA). 2022. Equity Action Plan. Available online: https://www.usda.gov/sites/default/files/documents/usda-equity-action-plan-508c.pdf
U.S. Department of Agriculture Economic Research Service (USDA-ERS). 2023. Farm Income and Wealth Statistics. “Data Files: U.S. and State-Level Farm Income and Wealth Statistics.” Available online: https://www.ers.usda.gov/data-products/farm-income-and-wealth-statistics/data-files-us-and-state-level-farm-income-and-wealth-statistics [Accessed July 2024].
U.S. Department of Agriculture Farm Service Agency (USDA-FSA). 2022. USDA. Agriculture Risk Coverage (ARC) & Price Loss Coverage (PLC) Fact Sheet. Available online: https://www.fsa.usda.gov/Assets/USDA-FSA-Public/usdafiles/FactSheets/2022/fsa_arc_plc_factsheet_101922.pdf
U.S. Department of Agriculture National Agricultural Statistics Service (USDA-NASS). 2019. 2017 Census of Agriculture. Report AC-17-A-51. Washington, DC.
U.S. Department of Agriculture National Agricultural Statistics Service (USDA-NASS). 2024. “Data and Statistics. Request Access to Restricted Microdata.” Available online: https://www.nass.usda.gov/Data_and_Statistics/Special_Tabulations/index.php
U.S. Government Accountability Office (U.S. GAO). 2019. Agricultural Lending Information on Credit and Outreach to Socially Disadvantaged Farmers and Ranchers Is Limited. GAO-19-539.

