In response to the COVID-19 pandemic, the U.S. government implemented multiple assistance and stimulus packages to aid consumers and businesses, including agricultural producers. Agricultural operations qualified for assistance from three relief programs in 2020: The Coronavirus Food Assistance Programs (CFAP 1 and CFAP 2) are targeted exclusively at agricultural producers and include direct payments to eligible operations. With some exceptions, producers of agricultural commodities (crop, livestock, dairy, or aquaculture) for which prices declined by 5% or more were eligible for a CFAP payment (Johansson et al., 2020). Some commodities (such as hemp, alfalfa mustard, etc.), for which price data were not available, were also eligible for payments under CFAP (Johansson et al., 2020). A third program for which agricultural producers qualified was the Paycheck Protection Program (PPP) administered by the Small Business Administration (SBA). The PPP was designed to help small businesses keep employees on the payroll and offset some of their operating costs. The maximum loan amount, which was forgivable if used during the 24-week period following the first disbursement of the loan on eligible expenses (payroll and allowed overhead expenses), was 2.5 times the monthly average profit plus payroll costs, including eligible overhead costs (employer insurance payments, employer unemployment taxes, etc.) (SBA, 2020). PPP data on each of the loans, including agricultural businesses loans, were released on December 1, 2020. This article examines the PPP participation rate, the average amount received, and PPP distributions relative to labor cost at the state level for the agriculture sector.
U.S. agricultural producers rely on the USDA for grants and other government payments administered under the Farm Bill. Ad hoc programs—such as the Market Facilitation Program (MFP), which provided direct payments to producers in response to retaliatory tariffs, and CFAP—are also administered by the USDA. Other federal departments and agencies were responsible for managing other ad hoc support programs created to provide assistanceto compensate for losses caused by the pandemic. The 2021 Omnibus Appropriations Bill, which the U.S. Congress passed in December 2020 and President Trump signed into law, renewed the PPP, adding almost $300 billion; small businesses, including agricultural businesses, started applying and receiving loans in 2021. The 2021 American Rescue Plan (ARP) Act also includes an additional $50 billion for continued PPP loans.
Family farms accounted for more than 98% of all farms in 2019 (Whitt, Todd, and MacDonald, 2020). Because such farms play an important role in rural economies, the PPP program had and will continue to have a substantial impact on the economic wellbeing of rural America. Better understanding of various aspects of the PPP loans can provide lessons for the design and implementation of future programs aimed at supporting small businesses in general and rural farm businesses in particular.
We use data at the PPP participant level from the SBA, along with microdata from the Agricultural Resource Management Survey (ARMS) and USDA’s state-level employment data from the Farm Income and Wealth data product for our analysis. ARMS, administered annually by the National Agricultural Statistics Service (NASS) and the Economic Research Service (ERS), is the most comprehensive source of data on economic variables related to the farm sector, including labor expenses. The data released by the SBA provide information on the loan size and number of jobs retained. However, the SBA data alone do not provide any information on the impact of PPP loans on producers. Data on labor expenses from ARMS and farm income and wealth statistics (U.S. Department of Agriculture, 2020b) help connect SBA data to labor expenses to gain meaningful insights. Ideally, 2020 ARMS data, which collects information on participating farm operations for the year 2020, would show the impact of PPP on producers. The most recent ARMS data, however, are from the 2019 ARMS and, therefore, we use these data to provide a benchmark for the analysis.
| Farm Type | Total Eligible Farm Operations |
Number (and Percent) of Farm Operations That Applied for PPP |
Total PPP Loan ($millions) |
Total Reported Jobs |
| Livestock | 320,135 | 39,545 (12%) | 2,058 | 235, 141 |
| Crops | 377,695 | 81,300 (21%) | 3,805 | 501,310 |
| Total | 697,830 | 120,845 (17%) | 5,863 | 736,451 |
Data released by the SBA show that more than $525 billion in PPP payments were disbursed through more than 5.2 million loans in 2020. Based on the 2019 ARMS data, 72% of all commercial farm operations had either positive net income or positive payroll expenditures, and therefore would meet the two most important requirements for eligibility to apply for PPP loans. Individual SBA loan data show that almost 121,000 (17% of eligible farm operations based on ARMS data) applied for a total of $5.9 billion in PPP loans (Table 1). SBA reports an average loan amount of $48,517.
Table 1 shows that crop farm operations applied for PPP loans at a higher rate (21% of eligible farm operations) compared to livestock farms (12% of those eligible). Of the total $5.9 billion in PPP loans, $2.1 billion (35%) went to livestock operations, and the remaining $3.8 billion (65%) went to crop operations. The number of employees paid by PPP loan in the crop sector (501,310) is more than twice that of the livestock sector (235,141). This is most likely because for many crop operations, labor cost as a share of total gross farm income is higher than for many livestock operations (U.S. Department of Agriculture, 2020a).
The major objective of the PPP was to allow employers who applied for and received the loan to pay employees by covering payroll expenses. Producers without employees but with positive net income were provided with funds to cover their income (in this case, their net returns, which are defined and counted as income by sole proprietors). A business had to use at least 60% of the loan amount for payroll expenses in order to receive full loan forgiveness in the 24-week period after receiving the PPP loan.
No information on the proportion of the PPP loans used for payroll expenses, as opposed to the amounts used for other authorized spending, is available. To compare the loan amounts to payroll expenses, we consider an upper bound (entire loan used for payroll) and a lower bound (60% of the loan used for payroll). Neither bound is exact, as more likely than not farm businesses used between 60% and 100% of the loan volume for payroll expenses but the bounds provide insights into annual payroll expenses relative to total PPP loan.
| Farm Type | Total Annual Hired Labor Expense ($millions) |
Total PPP Loan ($millions) |
Share of Hired Labor Expense Covered |
60% of the PPP ($millions) |
Share of Hired Labor Covered by 60% of PPP |
| Livestock | 7,932 | 2,058 | 26% | 1,235 | 16% |
| Crops | 19,243 | 3,805 | 20% | 2,283 | 12% |
| Total | 27,175 | 5,863 | 22% | 3,518 | 13% |
Funds from the PPP loans had to be disbursed within 24 weeks of receiving the loan, largely to allow greater flexibility in planning and use of funds. Table 2 shows that the disbursed PPP loans amounted to 22% of total annual hired labor expenses for the farm sector so if all loans were used to on hired labor wages, they would cover slightly more than 2.6 months of the year (2.6/12 months = 22%). Operations in the livestock sector would cover 26%, or slightly more than 3 months of labor expenses, while those in the crop sector would cover 20% (about 2.4 months). It is important to note that not all farms qualified and not all farms that qualified applied, as stated above, and the labor costs are for all farm operations.
If farm operations were to use only 60% of the PPP loans on hired labor expenses, the minimum required to receive full forgiveness of the PPP loan, this would offset 13% of the labor expenses, or about 1.6 months of payroll expenditures (Table 2). Loans to the livestock sector applied exclusively to wages would cover 16%, or almost 2 months of labor expenses, while loans to the crops sector would cover 12%, about 1.5 months (Table 2).
Three limitations of these results should be noted: 1) We do not factor in profit or net returns that are allowed by the PPP, 2) labor expenses are not uniform throughout the year and therefore may not match up with the 24-week window targeted by PPP, and 3) we assume that all loans will be forgiven. The third limitation is a significant one that could change the results. We do not know yet whether the forgiveness conditions have been met since the SBA has not released any data on PPP loan forgiveness. If PPP recipient farm operations do not meet loan forgiveness criteria and have to return some money, it will affect the number of months the PPP loans covered, the jobs retained, and the labor costs they offset. Further, changes in the labor situation after receiving the loan could also affect the results. For instance, a farm employee leaving work after the farm operator has received the PPP loan would change the payroll cost thereby changing the results. The number of jobs retained are self-reported numbers by the PPP applicants. The exact number of jobs retained will be known after the loan forgiveness information is available. Because the lenders are still processing new loans, it is unlikely that data on forgiveness will be available in the near term. The analyses and results in this paper should be interpreted as preliminary, intended to provide insights into the impact of the PPP on U.S. producers. Many producers claim the net returns to the farm enterprise as family income at the end of the year. This analysis does not include these net returns. Finally, since not all eligible farm operations applied for the PPP loans, some farms will not have been able to offset any hired labor expenses.
Source: SBA.

Source: SBA.
Source: SBA and U.S. Department of Agriculture (2020b).
Source: USDA Economic Research Service calculations using
2019 ARMS and the SBA data.
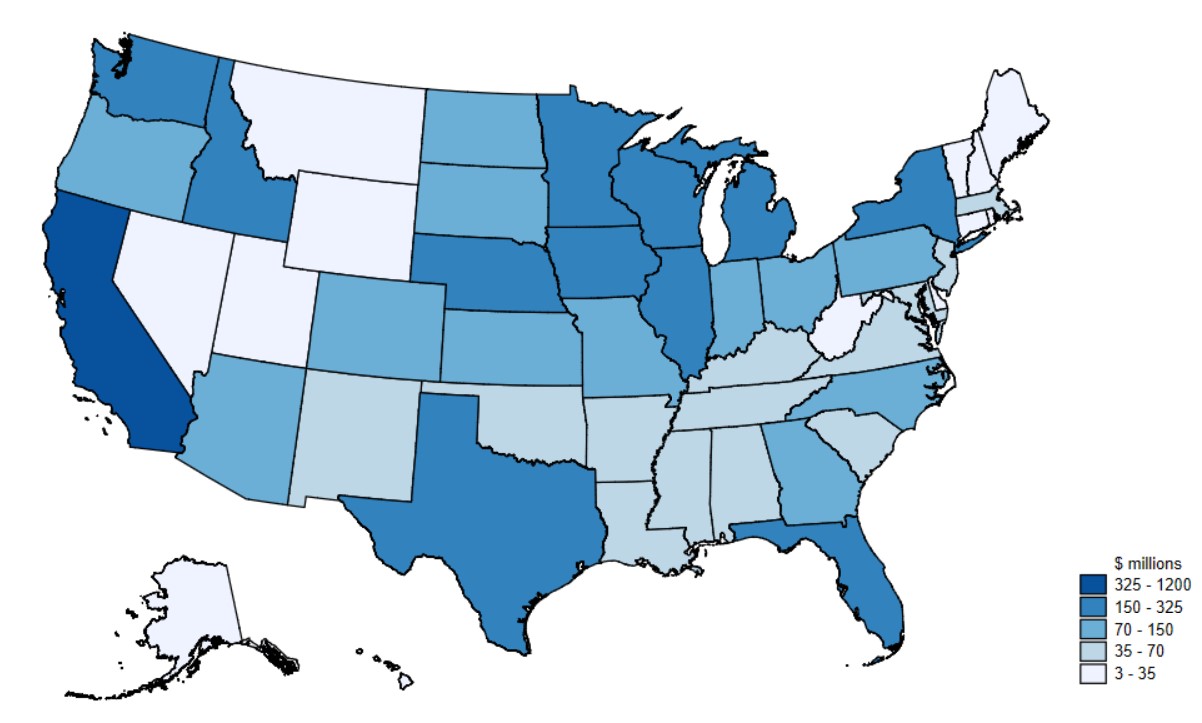
The largest loan total of $1.2 billion was made to California producers (Figure 1). The highest average loan ($170,745) was made to California producers and the lowest average loan ($19,931) was received by South Dakota producers. This is expected as California had the highest average hired labor expense ($193,165) and highest average net farm income ($256,953) based on the 2019 ARMS data. Further, the contribution of Californian producers to total U.S. cash receipts was highest, at $53 billion (13% of total cash receipts) (U.S. Department of Agriculture, 2020b). The lowest total loan amount ($3.9 million) was made to producers in Alaska. This is also an expected result as the contribution of Alaskan producers to the total cash receipts was only $61 million (less than 1% of total cash receipts) (U.S. Department of Agriculture, 2020b).
Based on data provided by the SBA, the maximum number of agricultural jobs retained, 136,692, were those of California workers and the lowest number, 396, were retained in Alaska. Figure 2 shows the total number of agricultural jobs retained in each state. In addition to California, Washington, Oregon, Texas, and Florida are among the states with the highest job retention. These states are part of what the Economic Research Service calls the “Fruitful Rim” (Heimlich, 2000), which is characterized by production specialized in fruit, vegetables, and cotton, which are relatively labor intensive compared with other crop production. The Heartland and parts of the Northern Crescent also realized higher-than-average total job retention. These states make up the Midwest and Upper Midwest and are specialized in cash grains and dairy production.
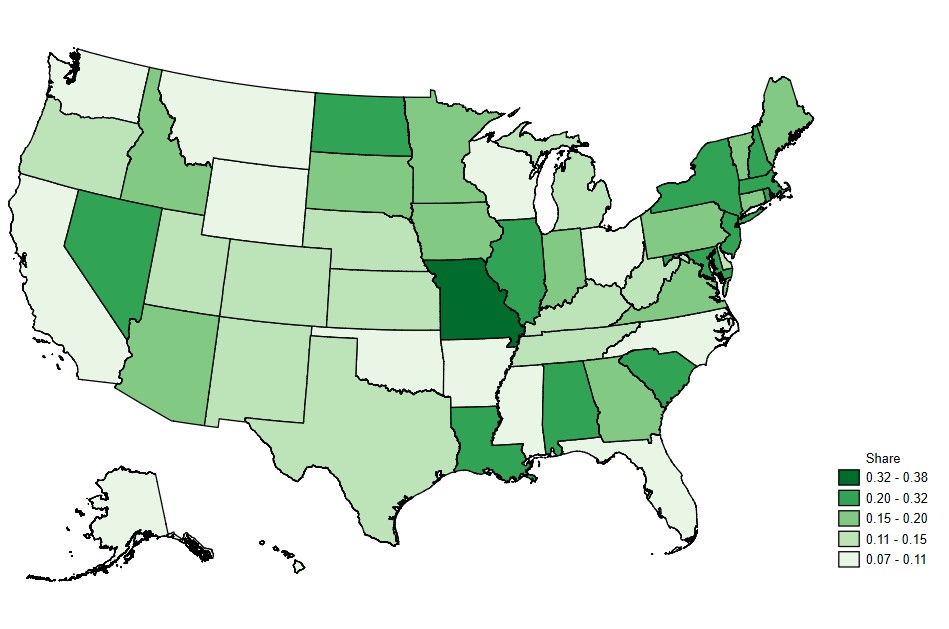
Figure 3 shows the share of total annual hired labor expenses represented by 60% of the PPP loan totals at the state level. We use 60% of the PPP loan totals since loan forgiveness was predicated on 60% of each loan going to labor expenses. Some states with relatively high labor costs—like California, Washington, and Florida—were among those with the lowest PPP loans as a share of total labor expenses. Generally, states with relatively high PPP loans as a share of hired labor expenses were those with the lowest total annual labor expenses. However, there is no clear pattern: Missouri received the highest PPP loans as a share of hired labor expenses but had the 15th lowest labor expenses for 2019.
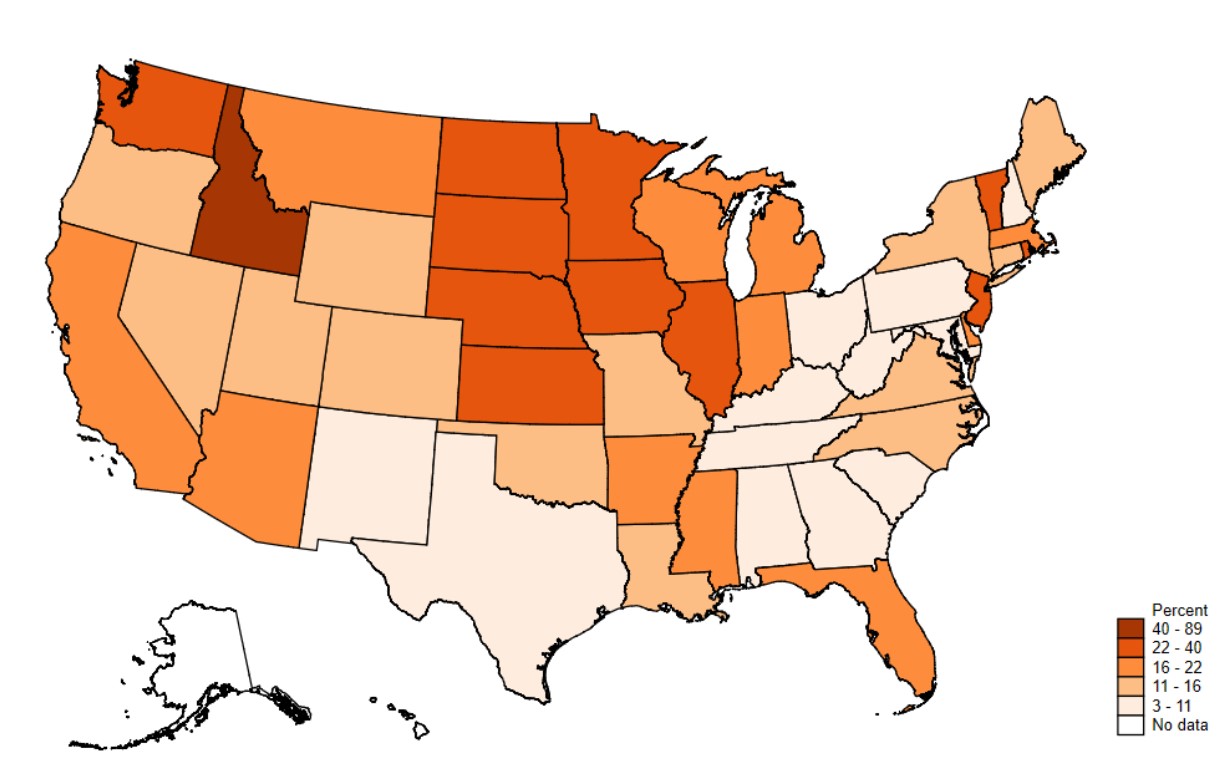
Based on our calculations, only 17% of farm operations participated in the PPP. Figure 4 shows the participation rate across states, calculated as the number of participants divided by the number of eligible farms (farm operations with positive net income or positive payroll). The participation rate varies widely, from 88% in Idaho to 3% in West Virginia. The average loan size for Idaho producers was $96,159 and for West Virginia producers it was $39,194.
There is considerable geographic variation in the participation rates. In addition to Idaho, high participation rates are clustered in the Heartland and Northern Great Plains regions, which specialize in cash grains, wheat, cattle and sheep production. Participation rates were lower in Texas, New Mexico, and states comprising the Southern Seaboard. Data on the number of eligible farms were not available for Hawaii and Alaska.
It appears that the PPP program helped to pay a significant number of employees in the agricultural sector and contributed to the general economic well-being of rural America. However, the participation rate of eligible producers was fairly low, most likely because the PPP program was a new program and was administered by a different agency than the usual contact agency with which farmers are familiar (USDA). There were only about 121,000 applications for the PPP program, which is significantly lower than the number of applications for the USDA administered CFAP even though both programs are new ad hoc programs designed to provide aid to those affected by the pandemic. As of the end of 2020, there were 652,201 and 880,971 approved applications for CFAP 1 and CFAP 2 programs, respectively, showing a significantly higher participation rate for programs administered by the USDA. It is important to note that the requirements for the two programs, PPP and CFAP, were different.
If all eligible farm operations had applied for the PPP loans, at the average loan amount based on data from SBA, farm operations would have received $35.7 billion compared to the $5.9 billion actually received. Since the PPP program has been renewed in the new relief program and there are additional funds, simply increasing the participation rate would provide more relief to the agricultural sector and rural America in general. Based on the SBA (2021) announcement, the first draw of the PPP loans will be for borrowers who have not previously received a PPP loan.
Heimlich, R.E. 2000. Farm Resource Regions. Washington, DC: U.S. Department of Agriculture, Economic Research Service, Agricultural Information Bulletin, AIB-760, January.
Johansson, R., A. Hungerford, M. Sewadeh, and A. Effland. 2021. “Unprecedented Crisis Calls for Unprecedented Policy Responses.” Applied Economic Perspectives and Policy 43(1): 120–131.
Small Business Administration. 2020. Paycheck Protection Program. Available online: https://www.sba.gov/funding-programs/loans/covid-19-relief-options/paycheck-protection-program,
Small Business Administration. 2021. First Draw PPP Loans. Available online: https://www.sba.gov/funding-programs/loans/coronavirus-relief-options/paycheck-protection-program/first-draw-ppp-loans.
U.S. Department of Agriculture. 2020a. Farm Economy, Farm Labor. [Webpage]. Washington, DC: U.S. Department of Agriculture, Economic Research Service. Available online: https://www.ers.usda.gov/topics/farm-economy/farm-labor/ [Accessed March 24, 2021].
U.S. Department of Agriculture. 2020b. Farm Income and Wealth Statistics. [Webpage]. Washington, DC: U.S. Department of Agriculture, Economic Research Service. Available online: https://www.ers.usda.gov/data-products/farm-income-and-wealth-statistics/ [Accessed December 30, 2020].
U.S. Department of Agriculture. 2020c. Secretary Perdue Statement on Economic Injury Disaster Loans Being Available to U.S. Agricultural Businesses Impacted by COVID-19 Pandemic. Washington, DC: U.S. Department of Agriculture, Press Release 0239.20. Available online: https://www.usda.gov/media/press-releases/2020/05/04/secretary-perdue-statement-economic-injury-disaster-loans-being.
Whitt, C., J. Todd, and J. MacDonald. 2020. America’s Diverse Family Farms 2020 Edition. Washington, DC: U.S. Department of Agriculture, Economic Research Service, Economic Information Bulletin, EIB-220, December.

