The year 2020 will be remembered for several striking events. Perhaps most notably, the COVID-19 pandemic has produced a severe shock to the economy. The famous influenza outbreak of 1918–1919 killed an estimated 675,000 Americans and led to a 1.5% drop in GDP. In comparison, the 2020 pandemic has already resulted in more than 500,000 deaths and a 3.5% drop in GDP—the largest one-year plunge since recordkeeping began after World War II.
The documented unemployment rate in the United States rose from 3.5% in February 2020 to 14.7% in April 2020, with serious consequences for the agricultural sector (Peña-Lévano, Burney, and Adams, 2020). At the outset of 2021, an estimated 10–12 million unemployed individuals remained. Most of these workers held low-wage jobs in the service sector, which accounts for approximately 80% of total employment, reinforcing long-run trends in economic inequality.
Much of the emphasis on the persistent unemployment due to COVID-19 has focused on urban bars and restaurants devastated by stay-at-home orders, social distancing requirements, and the large number of office staff now working remotely from home. The customer base for these businesses has disappeared. Unfortunately, comparatively little is known about rural unemployment. We seek to better understand how the COVID-19 pandemic has impacted rural unemployment in agriculturally dependent communities.

Source: U.S. Bureau of Labor Statistics
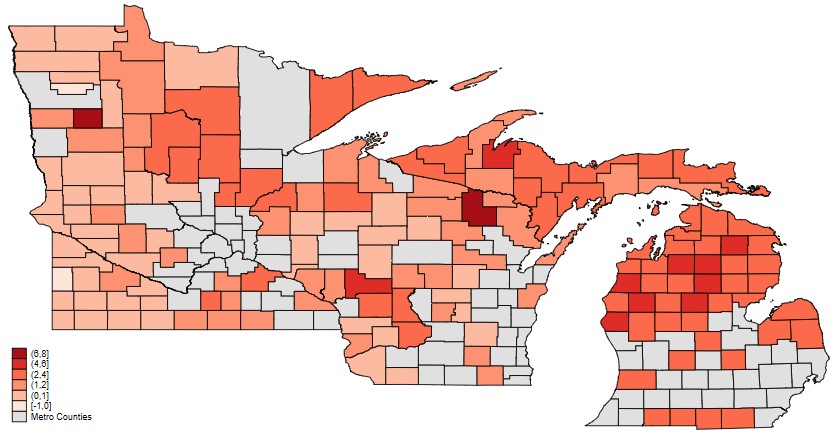
Even though COVID-19 has impacted employment numbers in the services sector more heavily than in the agricultural production sector (Peña-Lévano, Burney, and Adams, 2020), the pandemic certainly hit rural counties hard. Figure 1 shows the year-over-year change in the unemployment rate for nonmetropolitan counties in Michigan, Minnesota, and Wisconsin from September 2019 to September 2020. In some counties, unemployment increased by over 7 percentage points. In other areas, however, unemployment actually decreased by a small amount.
Regional patterns in these unemployment numbers suggest that some of the variation may be explained by differences in the agricultural economy of each county. It may be the case, for example, that row-crop operations are more insulated from the labor market than are dairy operations. If that is the case, policy makers concerned about rural unemployment will need to pay close attention to the structure of a county’s agricultural sector to understand how insulated the community may be from future sustained shocks to the labor market.
In this article, we explore how the composition of a county’s agricultural sector affects the unemployment impacts the county suffered due to COVID-19. More generally, our research sheds light on whether and how counties with more labor-intensive agricultural sectors are at greater risk from shocks to the broader labor market. Our findings suggest rural communities that rely heavily on hired agricultural or food processing labor will require more robust public safety nets to deal with future crises compared to communities with less labor-intensive agricultural sectors. This research contributes to a small but growing literature exploring how COVID-19 has impacted the labor market in the agricultural sector and food system more broadly (Charlton and Castillo, 2021; Malone, Schaefer, and Wu, 2021; Luckstead, Nayga, and Snell, 2021).
We analyze states that are similar enough to be compared with each other but that also contain a wide range of different types of agriculture. Our sample focuses on counties in Michigan, Minnesota, and Wisconsin. These three states are similar in many ways, but their agricultural sectors differ significantly. Michigan is known among the Midwestern states for its specialty crops, Minnesota relies more on row crops (e.g., corn and soybeans), and Wisconsin describes itself as America’s Dairyland. As a result of these differences, the agricultural sectors across these three states vary widely in the amount of hired labor they require. The more hired labor a farm requires, the greater the potential for layoffs (and resulting unemployment) before the entire operation is forced to fold.
Within our three states, we focus on only rural counties. Because the COVID-19 pandemic affected people across the economy, we focus on counties where unemployment in the agricultural sector would be least obscured by other industries. We therefore exclude any counties deemed metro by the Office of Management and Budget (U.S. Department of Agriculture, 2013). These excluded counties are shaded grey in Figure 1. Note that many metro counties nonetheless contain a lot of agricultural activity. For example, in Wisconsin, we omit counties around Green Bay, which have the greatest concentration of dairy cows in the state. This may mute the power of our analysis with respect to dairy, but we believe it leaves us with conservative estimates that are more cleanly separated from other sectors of the economy (like manufacturing or meat processing). We are left with 160 rural counties for our analysis.
We analyze monthly county-level unemployment data from January 2010 through October 2020 from the Local Area Unemployment Statistics program at the U.S. Bureau of Labor Statistics (2020).
To characterize each county’s agricultural sector, we utilize county-level data from the 2017 Census of Agriculture (U.S. Department of Agriculture, 2017). We define total agricultural sales (measured in dollars) as the sum of crop sales and animal sales. Crop sales includes both row-crop and specialty-crop sales. Animal sales includes all livestock, poultry, dairy, and other animal-based agricultural sales. Dairy sales were measured by milk sales.
For purposes of clarification, suppose that—according to the Census of Agriculture—a county has $600 million in crop sales, $200 million in animal sales, and $100 million in milk sales. Recalling that milk sales are part of animal sales, we would conclude that this county has a crop-sales share of 0.75 ($600 million/$800 million), an animal-sales share of 0.25 ($200 million/$800 million), and a dairy-sales share of 0.125 ($100 million/$800 million).

Source: 2017 USDA Census of Agriculture, authors’ calculations.

Source: 2017 USDA Census of Agriculture, authors’ calculations.
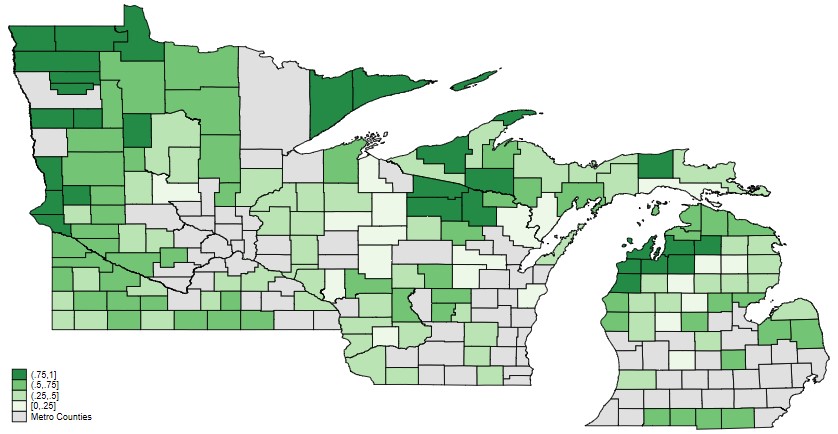
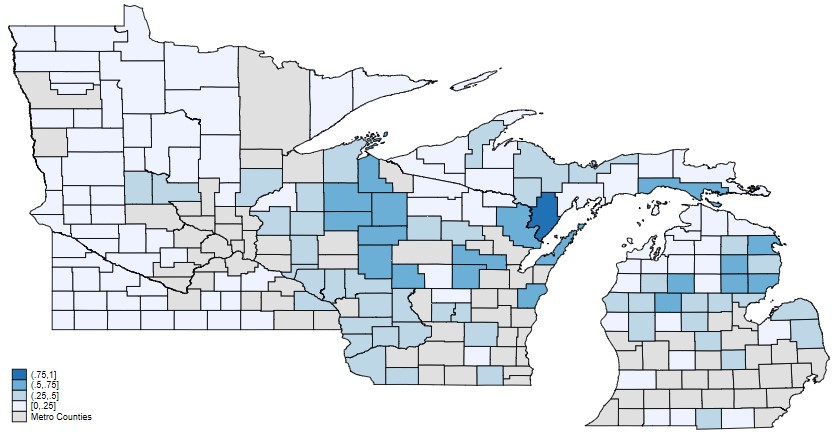
Among rural counties in Michigan, Minnesota, and Wisconsin, we see a wide range of agricultural composition. Figure 2 displays the geographic distribution of counties’ crop-sales share: In some counties, crop sales represent less than 20% of all agricultural sales. In others, crop sales account for almost all the county’s agricultural sales. On average, crop sales account for around half of agricultural sales in our sample. Note that the animal-sales share is defined as the complement of crop-sales share, so Figure 2 also implicitly maps counties’ animal-sales share. Figure 3 displays the geographic distribution of counties’ milk-sales share: We see counties in Wisconsin and northern Michigan more dependent on dairy than counties in Minnesota.
We analyze how the COVID-19 pandemic differentially affected unemployment rates in rural counties that are dependent on crops compared to those that are more dependent on animal agriculture or dairy. We accomplish this by using a method called difference-in-differences.
Our difference-in-differences approach evaluates each county’s unemployment rate over time. The first “difference” in the difference-in differences model compares unemployment rates before the start of COVID-19 to unemployment rates after the start of COVID-19. The second “difference” compares counties that are more reliant on dairy (for instance) to counties that are less reliant on dairy.
To see how this works, consider a simple example. Suppose County A is 100% reliant on dairy and County B is 0% reliant on dairy. Further suppose that before COVID-19, both County A and County B had an average unemployment rate of 6%. After the start of COVID-19, County A had an average unemployment rate of 13%, while County B had an average unemployment rate of 11%. The difference-in-differences estimate is (13% – 6%) – (11% – 6%) = 2%. That is, we would conclude that a county being completely reliant on dairy caused the unemployment rate due to COVID-19 to be 2 percentage points higher than a county that did not rely on dairy at all.
In our analysis, we define the COVID-19 pandemic as beginning in April 2020 and extending through the end of our sample in October 2020. On average, the unemployment rate in our 160 rural counties increased by around 6% during the pandemic compared to the period between January 2010 and March 2020. We use the difference-in-differences method to explore how counties with relatively more reliance on different products (crops, animals, and dairy) compared to that average.
One concern with our approach is that it may not account for the many other factors that contribute to the unemployment rate in rural counties. We address this by including several sets of fixed effects to control for time trends, seasonality, and county-specific differences. In short, fixed effects capture information that is constant across our sample in different dimensions. For example, suppose that the unemployment rate in County C is always roughly 2 percentage points higher than the average unemployment rate in our sample. County fixed effects control for this persistent difference. The strength of our fixed effects approach is that we do not need to understand why there may be a persistent difference between counties (or years, or months of the year); the fixed effects simply capture this unobserved variation without us needing to fully explain it.
Using various levels of fixed effects, we account for long-term trends in unemployment rates, annual seasonality in unemployment rates, and pervasive differences in individual counties’ unemployment rates.
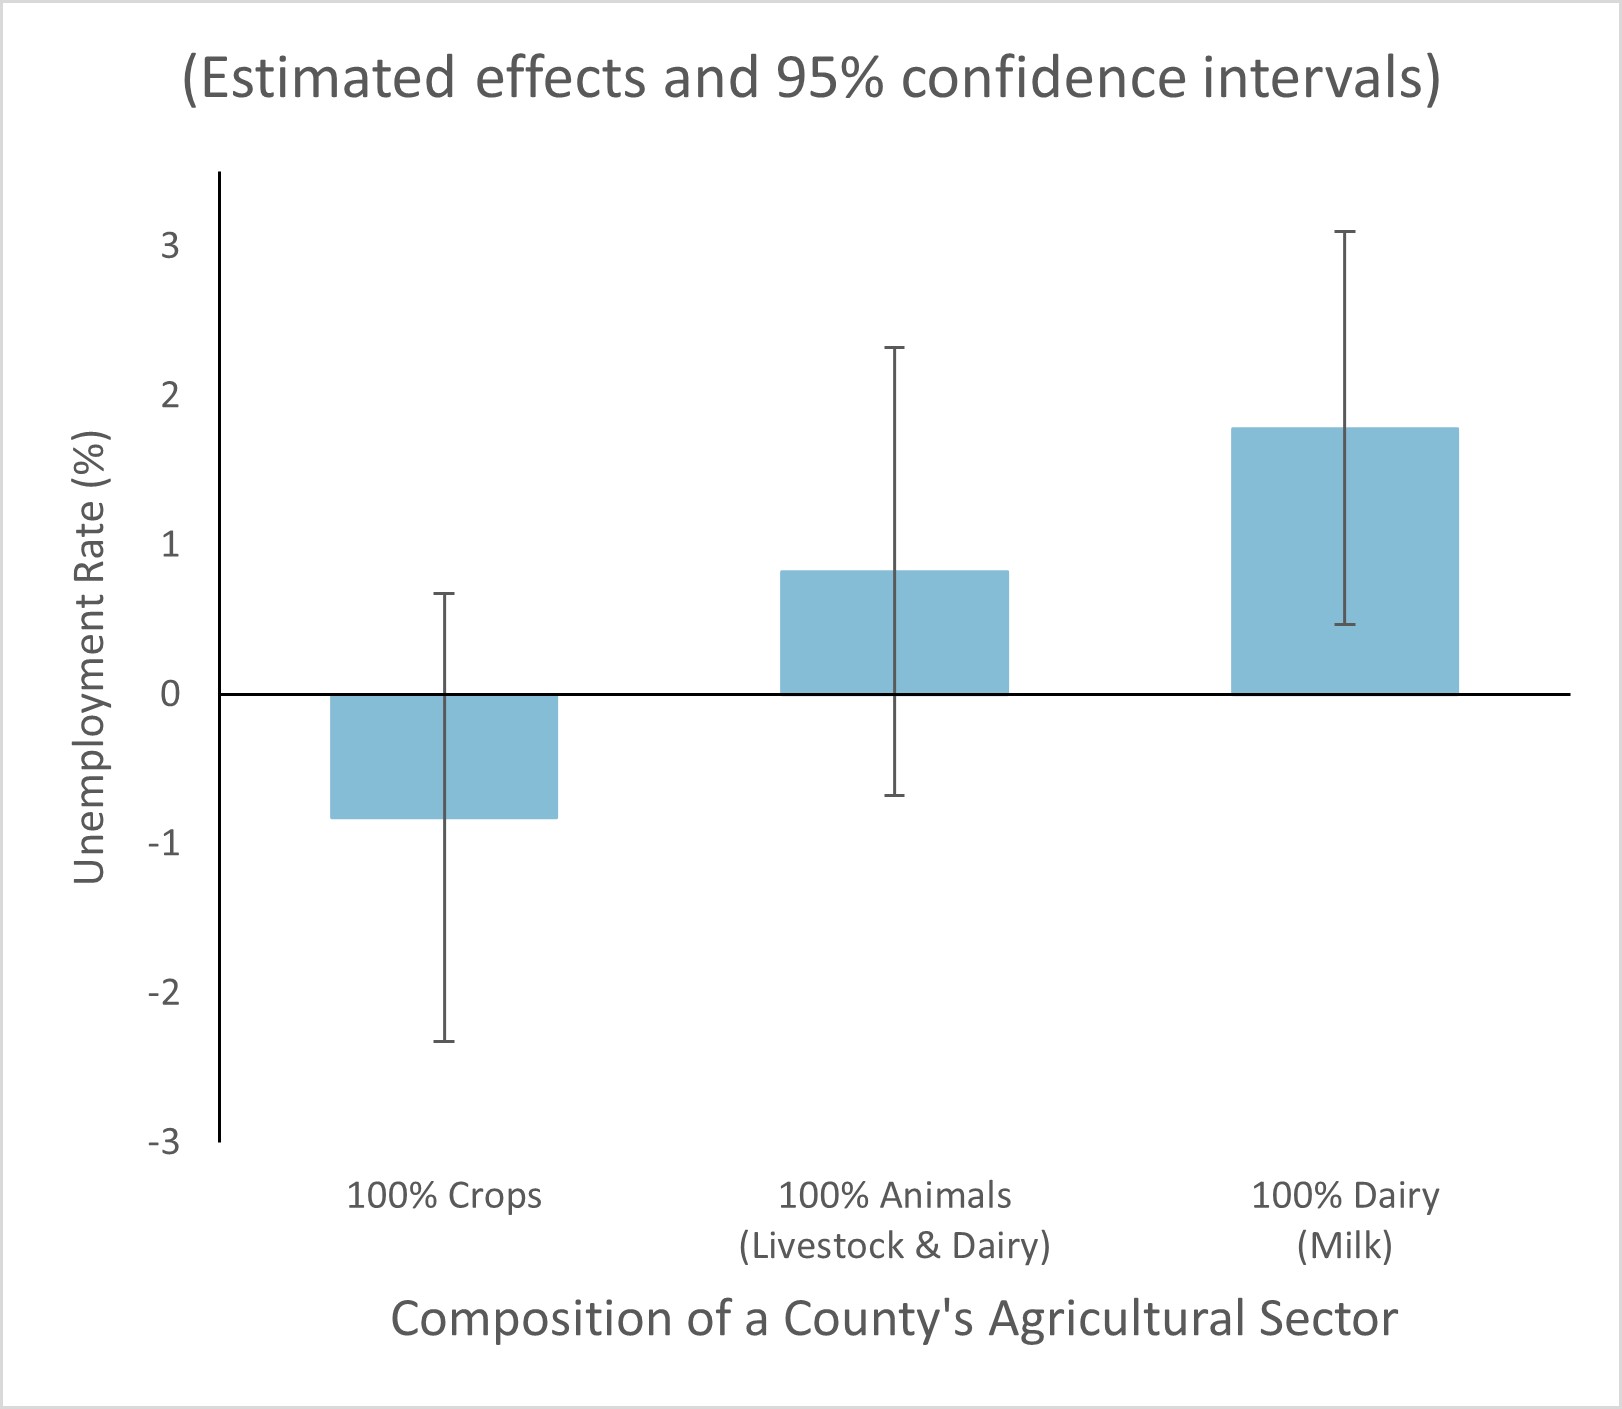
Our results suggest that rural counties in Michigan, Minnesota, and Wisconsin that are more reliant on dairy and animal agriculture have experienced higher unemployment rates during the COVID-19 pandemic than counties that are more reliant on crops. This makes intuitive sense because dairy and livestock operations tend to be more labor intensive than crop-based operations.

Source: Authors’ calculations.
The effects in Figure 4 should be interpreted relative to the average unemployment rate due to COVID-19. Recall from above that counties in our sample experienced a roughly 6% increase in unemployment due to COVID-19. Consequently, our results suggest that a county that relies completely on crop-based agriculture would have seen a 5.2% increase in unemployment due to COVID-19, while a county that relies completely on dairy would have seen a 7.8% increase in unemployment due to COVID-19.
The vertical lines in the center of each bar in Figure 4 represent 95% confidence intervals. Note that our estimated effects for counties with crop- and animal-based agricultural sectors are not statistically significant at the 95% level. However, our result for dairy-based counties is statistically significant (the bar extends beyond the vertical line). While our results would likely be more precisely estimated if we had a larger sample size, our findings are consistent with economic theory and our knowledge of the industry.
One of the most important economic trends over the past several decades has been the hollowing out of many rural economies. Small companies are closing or moving away. Schools, libraries, health clinics, and even hospitals face financial difficulties. The opioid pandemic has devastated many rural communities. These economic stresses are also correlated with increased political fragmentation.
The COVID-19 pandemic has compounded these stresses as we see mask wearing and calls for social distancing being resisted—even denounced—in some rural places. When workers in meat-packing plants became infected over the summer, the disease spread within their immediate families and to nursing homes and health centers where their spouses were employed. Local deaths spiked in several rural counties. Many infected workers, unable to go without a paycheck and frightened about their immigration status, felt forced to continue on the job.
These are difficult times in rural America, and they will continue to challenge citizens and policy makers alike. External shocks such as the COVID-19 pandemic rarely trigger large-scale economic shifts. Rather, they tend to reinforce pressures and tendencies that are already underway (Bartik et al., 2020).
Our findings here offer an early hint that difficulties across the rural countryside are likely to persist and may be concentrated in areas that are more dependent on hired labor. The key element in that consideration is to what extent rural employment, whether directly in agriculture, or in the rural towns that depend on agriculture, can recover to prepandemic levels (Barrero, Bloom, and Davis, 2020).
We note that the greatest job losses have been in areas more reliant on animal agriculture—especially in dairying. This makes some intuitive sense: Operations that hire laborers (like many animal and dairy farms) can lay them off, while operations that are run exclusively by owner-operators (like some row-crop farms) will only contribute to unemployment figures if the farm shuts down entirely. There are already labor pressures in the dairy sector. Recent hostility to immigrant workers, often the major source of labor on dairy farms, has driven many workers to repatriate south of the Mexican border and beyond. The resulting inability to find local labor is pushing many dairies to consider mechanization—a move that necessarily entails larger units to pay for expensive automated milking. One pressure point pushes another, which then pushes another (Hennessey and Feng, 2018; Feng et al., 2018).
Welcome or not, change is coming to rural America. Picturesque red barns are giving way to metal free-stall barns, farms are growing, toiling hands are being replaced by tireless machines. Rural towns are facing a steady decline in population accentuated by shocks like the COVID-19 pandemic.
Our research offers a mixed bag for rural communities. On the one hand, rural counties with labor-intensive agricultural sectors will suffer when the labor market experiences negative shocks. These communities may need more robust social safety nets to deal with these shocks when they come. On the other hand, rural counties with less labor-intensive agricultural sectors seem more insulated from labor market shocks. If there is a silver lining, it may be that as a county’s population dwindles, it may counterintuitively signal greater resilience to the ups and downs of the labor market.
Barrero, J.M., N. Bloom, and S.J. Davis. 2020. “COVID-19 Is Also a Reallocation Shock.” NBER Working Paper 27137, May.
Bartik, A.W., M. Bertrand, Z.B. Cullen, E.L. Glaeser, M. Luca, and C.T. Stanton. 2020. “How Are Small Businesses Adjusting to COVID-19? Early Evidence from a Survey.” NBER Working Paper 26989, April.
Charlton, D., and M. Castillo. 2021. “Potential Impacts of a Pandemic on the US Farm Labor Market.” Applied Economic Perspectives and Policy 43(1): 39–57.
Feng, H., D.A. Hennessy, Y. Jia, M.G.S. McKendree, and C.A. Wolf. 2018. “Dairy Sector Consolidation, Scale, Automation and Factor Biased Technical Change: Working through ‘Get Big or Get Out’.” Choices 33(4).
Hennessy, D.A., and H. Feng. 2018. “America’s Dairy Industry Facing Difficulties from Long-Running Structural Changes.” Choices 33(4).
Luckstead, J., R.M. Nayga Jr., and H.A. Snell. 2021. “Labor Issues in the Food Supply Chain Amid the COVID-19 Pandemic.” Applied Economic Perspectives and Policy 43(1), 382–400.
Malone, T., K.A. Schaefer, and F. Wu. 2021. “The Razor’s Edge of ‘Essential’ Labor in Food and Agriculture.” Applied Economic Perspectives and Policy 43(1): 368–381.
Peña-Lévano, L., S. Burney, and C. Adams. 2020. “Labor Disruptions Caused by COVID-19 in the U.S. Agriculture and Nonfarm Industries.” Choices 35(3).
U.S. Bureau of Labor Statistics. 2020. Local Area Unemployment Statistics. Available online: https://www.bls.gov/lau/home.htm.
U.S. Department of Agriculture. 2013. Rural-Urban Continuum Codes. Washington, DC: U.S. Department of Agriculture, Economic Research Service. Available online: https://www.ers.usda.gov/data-products/rural-urban-continuum-codes.aspx.
U.S. Department of Agriculture.. 2017. Census of Agriculture. Washington, DC: U.S. Department of Agriculture, National Agricultural Statistics Service. Available online: https://www.nass.usda.gov/Quick_Stats/