Trade conflicts between the United States and China have escalated recently. The Chinese government has threatened to impose a 25% tariff on 128 U.S. products in response to a U.S. proposal to impose a 25% tariff on imported products from China (USDA, 2018a). The Chinese list includes several agricultural products, including (but not limited to) soybeans, wheat, corn, sorghum, and beef. Among these commodities, soybeans is the largest agricultural export from the United States to China. Since the United States produces large amounts of soybeans (117 million metric tons (MMT) in 2016) and exports more than half that to other countries, the Chinese tariff on U.S. soybeans alone could generate major economic consequences for U.S. agriculture. In addition to soybeans, China also imports significant quantities of wheat, sorghum, and corn from the United States. Extending the coverage of Chinese tariffs on these products could amplify the economic implications of China’s retaliation policy for U.S. agriculture.
This article highlights the economic consequences of a possible Chinese 25% tariff on U.S. soybeans, wheat, corn, sorghum, and beef. To accomplish this task, we rely on the recent analysis done using the GTAP-BIO model (Taheripour and Tyner, 2018). We show that the Chinese retaliation trade policy, if implemented and continued for several years, could have major implications for the U.S. economy and its agricultural sector.
China is the world’s largest soybean importer and imported 93.5 MMT of soybeans in 2016, about 65% of global soybean imports (USDA, 2018b). China imports soybeans mainly from Brazil and the United States. The shares of these two countries in China’s imports in 2016 were about 44% and 42%, respectively. Currently, the United States and Brazil are the two largest soybean producers and exporters globally. They produced 116.9 MMT and 114.1 MMT of soybeans in 2016, respectively. In 2016, the United States exported 59.2 MMT of soybeans and Brazil about 63.1 MMT (USDA, 2018b).
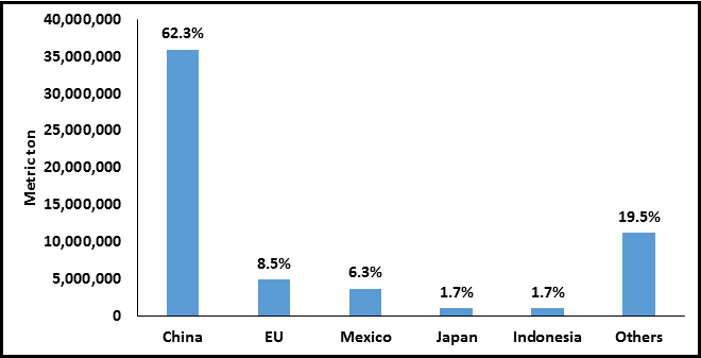
Note: Figures on the bars represent share of each country
in US soybeans exports.
Source: USDA (2018c).
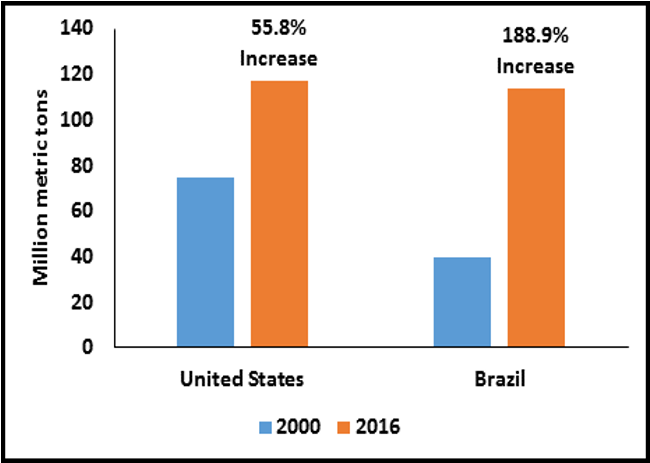
Source: USDA (2018c).
Figure 1 shows the major destinations for U.S. soybean exports. China is by far the largest importer of U.S. soybeans, followed by the European Union and Mexico. Until 2012, the United States was the world’s largest soybean producer and exporter. Since then, Brazil has exported more soybeans than the United States. While the United States is still the largest producer, Brazil could produce more soybeans than the United States in the future.
In recent years, production of soybeans has increased rapidly in Brazil, much faster than in the United States. Production of soybeans in the United States and Brazil were about 75.1 MMT and 39.5 MMT in 2000 (USDA, 2018b), respectively. In 2000, U.S. production was twice that of Brazil. Between 2000 and 2016, soybean production increased by 189% in Brazil and 56% for the United States (Figure 2). In this period, Brazil adopted GMO soybeans, which helped expand its soybean production rapidly.
Brazil competes very closely with the United States in the world soybean market. Since China is the largest soybean importer and imports large amounts of soybeans from the United States and Brazil, any changes in China’s soybean trade policies could have major implications for both the United States and Brazil.
The United States produced 384.8 MMT of corn, 62.8 MMT of wheat, and 12.2 MMT of sorghum in 2016 and exported, respectively, 14%, 46%, and 50% of these products to other countries (USDA, 2018b,c). The United States exports significant quantities of these commodities to China: 0.3 MMT of corn (0.5% of total U.S. exports), 0.9 MMT of wheat (3.8% of total U.S. exports), and 5.4 MMT of sorghum (78.8% of total U.S. exports) in 2016 (USDA, 2018c). While China receives very small shares of U.S. exports of corn and wheat, it is an important market for sorghum in addition to soybeans. China’s share of U.S. beef exports is insignificant.
Taheripour and Tyner (2018) used Global Trade Analysis Project-Biofuels (GTAP-BIO), a well-known global economic model, to evaluate the global economic impacts of Chinese tariffs on their imports of U.S. soybeans, corn, wheat, sorghum, and beef. Taheripour, Cui, and Tyner (2017) and Taheripour, Zhao, and Tyner (2017) described the latest version of this model and its improvements over time. GTAP-BIO traces production, consumption, and trade of all goods and services at the global scale by country. The simulations made with this model determine changes in demand and supply of all goods and services and their prices in each region; changes in bilateral trade among all trade partners for all goods and services; changes in allocation of resources; country-by-country changes in economic gains or losses (economic welfare); among other outputs. The latest version of this model represents the world economy in 2011. Since the global soybean market (and also markets for other agricultural products) experienced major changes in production and trade in recent years, Taheripour and Tyner (2018) updated the database of this model to represent the world economy in 2016 to provide more up-to-date analyses.
Economic models usually use trade elasticities to simulate trade relationships among trade partners worldwide. Smaller trade elasticities imply less reaction among trade partners in response to changes in economic variables (such as tariffs or other trade restrictions), and larger elasticities allow for larger responses. Therefore, the projections of these models depend on the sizes of the trade elasticities. The GTAP-BIO model uses a set of standard trade elasticities. We first examine the impacts of the 25% Chinese tariff on U.S. agricultural products with these standard trade elasticities. Recent research done at Purdue University by Yao and Hillberry (2018) suggests that soybean trade elasticities may be higher than the standard values in GTAP. Earlier work by Hillberry et al. (2005) also supports higher elasticities. For this reason, we repeat our simulation with a set of higher trade elasticities for soybeans. We present results for two simulation cases:
We present simulation results for changes in trade, production, producer prices, and welfare (economic well-being). It is important to note that the GTAP-BIO simulations represent medium- to long-run impacts, which means that the tariffs would need to remain in effect for at least 3–5 years. These are not short-run impacts.
Given that soybeans are traded worldwide, we analyze the trade impacts for this commodity in detail. Table 1 presents the changes in soybean trade given the standard and higher trade elasticities. In this table, rows represent major exporters and columns represent major importers. This table represents percentage changes in quantities of traded soybeans compared to the base year of 2016. Therefore, it is important to recall that the bases are quite different for each region. A large percentage change on a small base may not be as important as a small percentage change on a large base. In general, one can make the following major conclusions from the results presented in Table 1:
In general, the 25% Chinese tariff could reduce exports of U.S. soybeans to China by about 17 MMT in the long run given standard trade elasticities. In response in this case, the United States would export more to the European Union (by 0.65 MMT) and the rest of the world (by 2.6 MMT). With the standard trade elasticities, total U.S. soybean exports drop by 14 MMT. Given higher trade elasticities, China’s soybean imports from the United States drop by 32.6 MMT. In this case, U.S. soybean exports go up by 1.9 MMT to the European Union and by 10.7 MMT to the rest of the world. Given elevated trade elasticities, total U.S soybean exports drop by 20 MMT. These figures indicate that Chinese tariffs could seriously harm U.S. soybean exports.
The proposed Chinese tariffs will not significantly affect the global markets for corn, wheat, and sorghum or cause significant changes in the total U.S. exports of these products. However, the tariffs decrease U.S. exports of corn, wheat, and sorghum to China by 42% (0.11 MMT), 82% (0.74 MMT), and 13% (0.68 MMT), respectively. These results are not sensitive to the size of soybean trade elasticities.
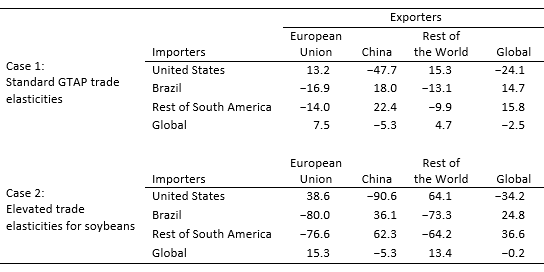
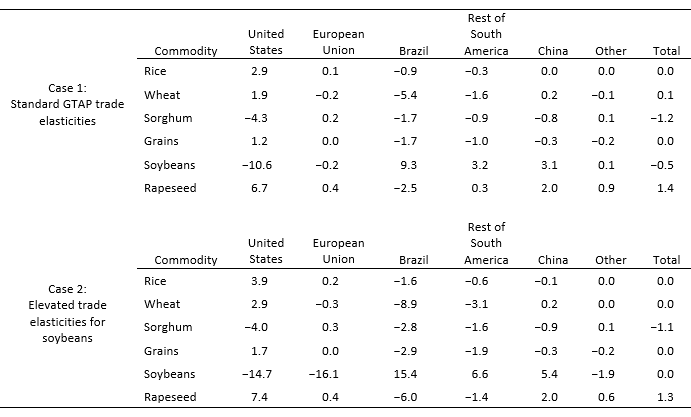
Table 2 presents the impacts of the examined cases on the outputs of selected commodities produced worldwide. The top panel shows the results for the standard trade elasticities and the bottom panel for the higher elasticities. The results represent percentage changes in the quantities of outputs of the selected commodities compared to the 2016 base year. Note again that these are 3–5 year, medium-term impacts after global changes in production have had time to materialize. The results all follow the expected patterns:
The results presented in Table 2 confirm that the Chinese tariffs could significantly reduce U.S. soybean production and increase soybean production in Brazil, the rest of South America, and China. U.S. sorghum production also declines to some extent.
It is important to note that the use of elevated soybean trade elasticities will change the outputs of other commodities as well. These changes are relatively large for the United States and Brazil. For the United States, given the elevated soybean trade elasticities, soybean production drops more, encouraging farmers to allocate more cropland to producing other commodities. On the other hand, given the elevated soybean elasticities, Brazil produces and exports more soybeans, encouraging farmers to shift a larger portion of land to soybean production.
The price impacts of the 25% Chinese tariff on the U.S. agricultural products are limited, according the simulation results obtained from the GTAP-BIO model, which projects medium- to long-run price impacts. The U.S. producer price for soybeans drops by about 4% in response to the 25% Chinese tariff, given the standard trade elasticities, and by about 5% given the higher elasticities. In both simulation scenarios, the changes in the producer prices for most other commodities in the United States and China are small. However, all agricultural commodity prices increase in Brazil, some by relatively larger percentages (2%–5%).
Table 3 provides changes in economic welfare. Economists use the concept of economic welfare to characterize changes in economic well-being of a country or region. Several general conclusions can be drawn from the economic welfare analysis:
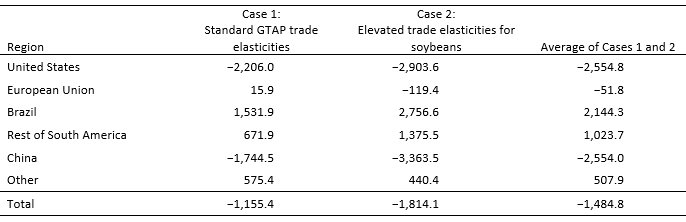
The simulation results examined in this paper show that the 25% Chinese tariff is a lose–lose proposition for both China and the United States. The loss in economic well-being is about the same in both countries. Brazil sees a significant increase in soybean production and an improvement in economic well-being.
Hillberry, R.H., M.A. Anderson, E.J. Balistreri, and A.K. Fox. 2005. “Taste Parameters as Model Residuals: Assessing the ‘Fit’ of an Armington Trade M.” Review of International Economics 13(5): 973–984.
Taheripour, F. and W.E. Tyner. 2018. Impacts of Possible Chinese Protection on US Soybeans. West Lafayette, IN: Purdue University GTAP Working Paper 83. Available online: https://www.gtap.agecon.purdue.edu/resources/res_display.asp?RecordID=5654
Taheripour, F., H. Cui, and W.E. Tyner. 2017. “An Exploration of Agricultural Land use Change at the Intensive and Extensive Margins: Implications for Biofuels Induced Land Use Change.” In Z. Qin, U. Mishra, and A. Hastings, eds. Bioenergy and Land Use Change. Hoboken, NJ, USA: American Geophysical Union (Wiley), pp. 19–37.
Taheripour, F., X. Zhao, and W.E. Tyner. 2017. “The Impact of Considering Land Intensification and Updated Data on Biofuels Land Use Change and Emissions Estimates.” Biotechnology for Biofuels 10:191.
U.S. Department of Agriculture. 2018a. China Responds to U.S. Section 301 Trade Action Announcement. Washington, DC: U.S. Department of Agriculture, Foreign Agricultural Service, Gain Report CH18018, April.
U.S. Department of Agriculture, 2018b. Production, Supply, and Distribution. Washington, DC: U.S. Department of Agriculture, Foreign Agricultural Service. Available online: https://apps.fas.usda.gov/psdonline/app/index.html
U.S. Department of Agriculture. 2018c. Global Agricultural Trade System. Washington, DC: U.S. Department of Agriculture, Foreign Agricultural Service. Available online: https://apps.fas.usda.gov/gats/
Yao, G., and R.H. Hillberry. 2018. Structural Gravity Model Estimates of Nested Constant Elasticity of Substitution Import Demands for Soybeans. West Lafayette, IN: Purdue University, Department of Agricultural Economics.
Link to working paper: https://www.gtap.agecon.purdue.edu/resources/res_display.asp?RecordID=5654

