This article discusses sorghum in a global context and describes how China became the world’s major importer. We present an overview of China’s sorghum consumption—both as food and as feed—and explain the sudden increase in imported sorghum from the United States, discussing the trade and domestic policies that led to this surge in sorghum imports and other feed alternatives to corn. Recent Chinese policies such as sorghum tariffs are discussed and prior forward-looking research anticipating potential disruptions in sorghum trade are presented. Last is a brief discussion on the importance of U.S. trade with China as well as U.S. exported agriculture products, which until recently have not faced trade restrictions and do not conflict with China’s food self-sufficiency and security policies.
In 2014/15, China became the world’s largest importer of sorghum, which is primarily used for animal feed. This sudden increase in sorghum imports was driven by demand for lower-priced livestock feed. Maintained by import restrictions with tariff-rate quotas (TRQs) and bans on unapproved genetically modified corn, China’s domestic corn prices were up to 1.5 times higher than the international market, despite subsidies to corn producers and, until recently, price supports for farmers (Gale, 2017). Sorghum does not have genetically modified varieties or TRQs, which could have been used to restrict imports.
Prior to the surge in sorghum imports, the Chinese feed sector had begun importing distillers’ dried grains with solubles (DDGS), another feed substitute for corn, from the United States in 2007. China quickly became the largest market for U.S. DDGS exports in 2010 and maintained this position from 2012 through 2016. However, in January 2017, China announced anti-dumping and countervailing duties on imports of U.S. DDGS. In 2017, U.S. DDGS exports to China decreased significantly, dropping from the top U.S. DDGS export market to eighth, a decrease of 84% from 2016 (USDA, 2018a).
Similarly, on February 4, 2018, China’s Ministry of Commerce announced an anti-dumping and countervailing duty investigation against the United States for China’s imports of U.S. sorghum grain. This announcement may have been a reaction to recent trade tensions between the United States and China, specifically U.S. tariffs on imports of Chinese solar panels (January 22, 2018) and washing machines (February 3, 2018) (Patton, 2018). Then on April 17, China announced an import duty of 178.6% on the value of U.S. sorghum imports, to be applied the following day, April 18. Traders and shippers reacted immediately, halting exports from U.S. ports. Ships already en route were diverted to alternative destinations, such as Saudi Arabia, Spain, Vietnam, and Japan. The U.S. Gulf sorghum export price fell by about 4% after China’s April 18 announcement (International Grains Council, 2018), but some sorghum farmers reported a much larger drop in the sorghum farm price. However, this import duty was short-lived, as China announced on May 18 that it would drop the 178.6% duty on sorghum imports from the United States and withdrew its anti-dumping investigation. Unfortunately, trade relationships do not quickly return to previously normal trading conditions. Given the uncertainty of trade issues and current relationship between the United States and China, both U.S. farmers and traders remain cautiously optimistic about the sorghum trade.
The world’s largest producers of sorghum are the United States, Nigeria, Mexico, India, and Sudan, with China typically ranked seventh or eighth largest. Production yields in the United States, China, and Mexico can be 3 to 8 times greater than yields in India and Sudan. Sorghum is produced in a number of U.S. states but most concentrated in Texas and Kansas, which account for about 80% of the U.S. area planted to sorghum (USDA, 2018c).
The world’s largest consumers of sorghum are typically its largest producers, since sorghum is a thinly traded market with few trading countries. However, China has emerged as the largest global consumer of sorghum in the past 5 years. The largest sorghum-consuming countries in 2016/17 for both food and feed were China, Nigeria, Sudan, Mexico, the United States, India, and Ethiopia (USDA, 2018b), accounting for 65% of the world’s sorghum consumption. Prior to 2013/14, most sorghum consumption in China (70%–80%) was for food, seed, and industrial use, not for feed (USDA, 2018b). Most sorghum was used to produce baijiu, a common Chinese alcoholic drink.
The largest markets for sorghum feed have historically been Mexico and the United States. Prior to 2012/13, the largest sorghum feed–consuming markets included Mexico, the United States, European Union, Brazil, Australia, Japan, and Argentina. Beginning in 2012, demand for sorghum feed increased in China; by 2014/15, China had become the largest sorghum-consuming country in the world. In 2013/14–2016/17, almost 75% of sorghum was used for feed in China. China’s dominance in sorghum consumption has continued to the present (USDA, 2018b).
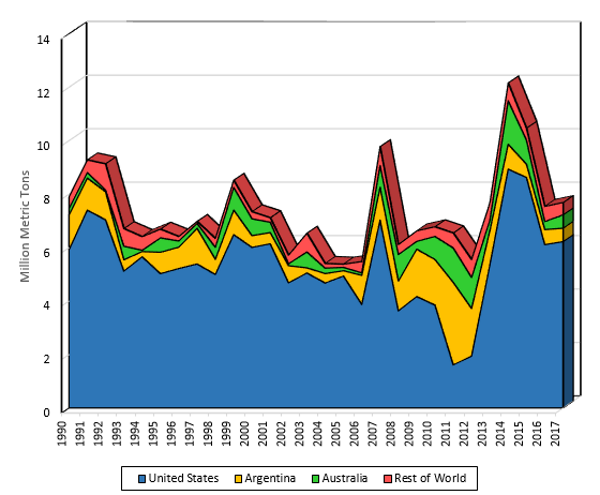
Source: USDA (2018b).

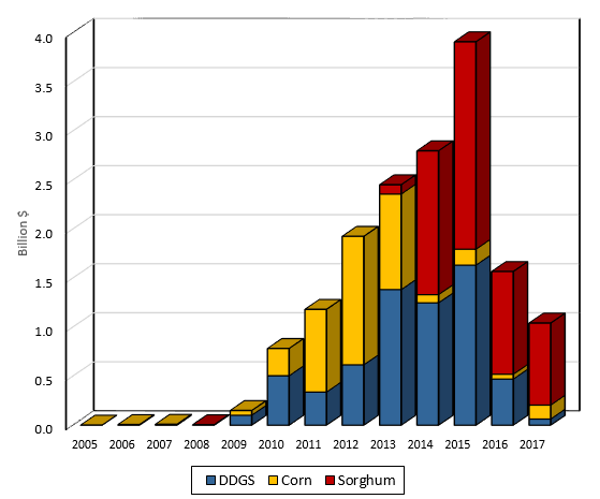
Source: USDA (2018a).
The United States is the largest sorghum exporter, accounting for 77% of the world share over the past 5 years (USDA, 2018b), followed by Argentina and Australia. These three countries account for close to 94% of global sorghum exports over the past 5–10 years (Figure 1).
Prior to 2012/13, China imported very little sorghum, totaling 224 thousand metric tons the previous 10 years (Figure 2). China exhibited strong growth in sorghum imports as a substitute feed for corn beginning in 2012/13, as the price of China’s domestic corn increased. China was the world’s largest sorghum importer from 2014/15 through 2017/18. China’s imports increased to 10.2 million metric tons by 2014/15, 82% of the world’s imports (USDA, 2018b). For the past 2 years, imports have been much less—5.2 million metric tons in 2016/17 and 5.6 million metric tons in 2017/18—as China’s domestic corn prices fell due to the elimination of its price support program and release of corn stocks.
U.S. sorghum producers responded to China’s increasing import demand by increasing sorghum-planted acreage beginning in 2013/14 (USDA, 2018c). U.S. sorghum exports have increased over the past 5 years, beginning in 2013/14, and averaged 7.1 million metric tons, compared to 3.7 million metric tons from 2008/09 to 2012/13 (USDA, 2018a). U.S. sorghum exports relative to production increased to their highest level (81%) in 2014/15 and have averaged 62% over the past 5 years, compared to an average of 35% from 2008/09 to 2012/13.
Prior to 2013, the United States did not export sorghum to China. Beginning in 2009, as China’s domestic corn prices increased, major U.S. feed exports to China included only DDGS and corn. By 2014, the value of sorghum exports surpassed DDGS and corn combined (Figure 3), and sorghum became the major U.S. feed export to China. The combined value of DDGS, corn, and sorghum was almost $4 billion in 2015, falling to over $1 billion in 2017 (USDA, 2018a). This decrease can be attributed to a variety of factors:
Since 2013, China has become the predominant market for U.S. sorghum exports, accounting for an average of 86% of U.S. sorghum exports from 2014 to 2017. In 2014, China imported 93% of U.S. sorghum exports (USDA, 2018a). Contemporaneously, as the United States increased its sorghum exports to China, exports to historically leading destinations such as Japan and Mexico fell.
The majority of China’s sorghum imports, close to 57% over the past 5 years, have been to the southern China ports of Huangpu and Guangzhou in Guangdong province, followed by Nanjing and Shanghai in central-coastal China, both on the Yangtze River. Together these four ports account for almost 80% of China’s sorghum imports over the past 5 years (GTA, 2018). The southern region does not have enough locally produced corn to meet the growing feed demand from its poultry and pork industries and must either import feed or procure it through boats from Northeast China. From these ports, grains are transported to large feedmills and feeding operations for pork, poultry, and ducks.
Corn is the primary feed grain in China. China’s agricultural and trade policies in the corn sector drive much of the growth for sorghum demand and imports (Zhang, 2017). China initiated a price support program and a temporary reserve program for corn in 2008 to support Chinese farmers’ incomes and to move China toward self-sufficiency (Gale, 2013). Under these programs, when the corn market price is less than the support price, the Chinese authorities purchase corn from farmers at the support price and accumulate corn in national storage facilities (Wu and Zhang, 2016). Under this price support and strategic reserve policy, China’s support price for corn continuously increased, reaching a high of $361 per metric ton in 2014/15. These artificial price signals increased China’s domestic corn production and generated excessive corn stockpiles (Hejazi and Marchant, 2017).
To sustain these price support policies, China needed to effectively control the supply of imports through TRQs on corn imports allocated to state-owned and non-state-owned enterprises. However, while China’s corn price remained high domestically, China’s feed operations sought to import cheaper feed substitutes such as sorghum, which was not subject to quantity restrictions or regulations on GM varieties (which did not exist). The absence of trade restrictions and TRQs on sorghum made it easier for a large number of Chinese feed compounders to import (Bond, et al. 2015). Sorghum is considered a low-cost feed substitute for corn, and China was projected to maintain high sorghum import volumes (Hansen and Gale, 2014). China’s sorghum feed-to-use ratio increased significantly, from less than 10% in 2010 to more than 80% in 2014. In contrast, China’s corn feed-to-use ratio remained steady during this period, at approximately 70% (Wang and Malaga, 2016). However, the magnitude of China’s sorghum market demand is still very small compared to China’s corn market (i.e., China’s corn demand continues to be much larger than China’s sorghum demand).
From 2016 onward, the situation began to change in China for three reasons: 1) extremely large corn stockpiles; 2) cheaper but limited corn imports from the world market; and 3) quality deterioration of Chinese corn stocks. China ended its price support policy and temporary reserve program for corn in the key producing geographic area, Northeast China—Heilongjiang, Jilin, Liaoning and Inner Mongolia—as a pilot program to decrease China’s excessive corn stockpiles. On March 28, 2016, Liu Xiaonan, China’s Deputy Director of the Economy and Trade Department of the National Development and Reform Commission (NDRC), announced that the temporary reserve policy in the three Northeastern provinces and in Inner Mongolia would be terminated. Instead, a new mechanism of “marketized purchases” and a direct payment subsidy policy toward corn would be implemented in these areas (Robinson, 2016). The change in China’s corn policy resulted in a lower Chinese domestic corn price, which brought higher corn demand. Thus, the demand for sorghum, one of most important corn substitutes for feed use, decreased significantly. This new policy led to declines in China’s corn price, corn production, and imports of sorghum.
Three previous studies have examined the impact of a reduction in China’s sorghum imports: Hansen, et al. (2015), Wang and Malaga (2016), and Zhang (2017). Because China is currently the world’s dominant sorghum importer, the U.S. and world sorghum market are likely to be significantly affected if China reduces sorghum imports.
According to Hansen, et al.’s (2015) research, if China banned almost all sorghum imports, a decrease of about 98%, the global sorghum price would fall on average about 25% over the projection period (2016–2025) and China’s global import share would fall sharply from 61% to 2%. In their analysis, China continued to import a small quantity of sorghum, about 90,000 metric tons, consistent with prior import behavior. Lower global prices would lead to increased imports by other countries, especially Mexico, and, to a lesser degree, Japan. As a result of China’s restriction on sorghum imports, production and exports in major sorghum supplying regions (the U.S., Argentina, and Australia) would decrease, due to lower global prices. Wang and Malaga’s (2016) results suggested that China’s sorghum imports will decrease when the government eliminates the subsidy policy for corn, which is the temporary reserve program for corn and the price paid by the government to farmers. This research indicates that sorghum imports by China will decrease, but not to the levels that occurred prior to 2013.
Zhang (2017) sought to analyze the impacts on the U.S. and global sorghum market if China reduced sorghum imports from all countries. Three scenarios were considered, with the largest being a 70% decrease in sorghum imports from the USDA-ERS’s baseline projection in year 1 and 90% in all subsequent years. This policy scenario affected China’s sorghum feed demand (40.56% decline), global sorghum price (18.3% decline), and China’s sorghum stocks (63.88% decline) significantly in the first year after the shock. Sorghum exports from the United States, Argentina, and Australia decreased by 25.04%, 36.16% and 13.36%, respectively, in the first year after the shock. Mexico’s sorghum imports increased by 63.49% for the first year. Japan’s sorghum imports did not increase significantly.
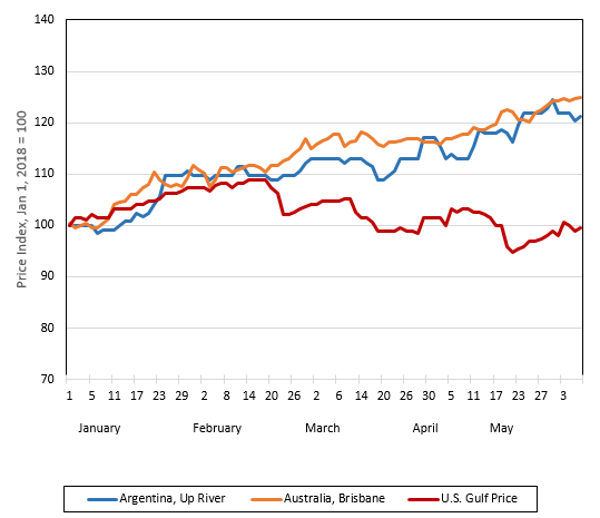
Source: International Grains Council (2018).
There are three major international sorghum export prices: 1) Argentina’s Up River price, 2) Australia’s Brisbane (QLD) price, and (3) the U.S. Gulf price (International Grains Council, 2018). These prices have exhibited diverging price patterns since mid- to late-February 2018, after China announced its anti-dumping and countervailing duty investigation on February 4. On January 1, 2018, the three prices (in USD/metric ton) were $123, $249, and $193 for Argentina, Australia, and the United States, respectively. From January 1 through February 19, all three prices increased. However, beginning on February 20, the U.S. price fell by 5% over the next 7 business days, while prices for both Argentina and Australia continued to increase. The Argentina and Australia prices increased by 21% and 25%, respectively, from January 1 through May 8. The U.S. Gulf price continued to decline after February 8, and by May 8 it had fallen to $192, almost to January 1 levels.
The day after China announced its 178.6% import duty on U.S. sorghum imports, April 17, the U.S. Gulf price decreased by almost 5%. In Figure 4, the three international daily prices are indexed to 100, beginning on January 1, 2018. Figure 4 exhibits the price divergence of the U.S. Gulf price from the Argentina and Australia prices from January 1 through May 8. By May 8, the U.S. Gulf price as 21% and 25% lower than the respective Argentine and Australian export prices, potentially showing one of the impacts of China’s import duties on U.S. sorghum.
Growing import demand by China for animal feed substitutes for corn—DDGS, sorghum, and barley—is a direct consequence of China’s domestic and trade corn policies. These policies increased China’s domestic feed costs for livestock higher than those of their international competitors. China’s feed industry has attempted to lower feed costs by importing feed from the United States and other countries. China’s imports of the U.S. DDGS grew rapidly, from almost $2 million in 2008 to $1.6 billion by 2015 (Figure 3). However, imports declined to $470 million in 2016 and to $63 million in 2017. The most recent decline is due to China’s 2017 announcement of anti-dumping and countervailing duties for DDGS.
U.S. sorghum exports to China also increased sharply, from $95 million in 2013 to $2.1 billion by 2015 and $1.04 billion in 2016, declining to $835.6 million in 2017 (USDA, 2018a). This recent decline is due to the drop in China’s domestic corn prices. Recent actions by the United States on a variety of products such as solar panels, steel, and aluminum and China’s trade actions against sorghum and other agricultural commodities raise uncertainty for U.S. exporters and Chinese importers of agricultural commodities.
Agricultural trade between the United States and China is critically important to job creation in both countries, lowering costs of production to create sustainable agricultural and food systems and satisfying growing and changing consumer demands. The U.S. agricultural trade experience with China has exhibited large variations depending on the specific commodities traded and China’s domestic and trade policy for these commodities. The greatest growth in U.S. exports to China has been in commodities that do not conflict with China’s domestic policies for maintaining self-sufficiency or food security and are in short supply in China. These include soybeans, hides and skins, specialized consumer food products, alfalfa for dairy, certain types of nuts, and other food products that are not domestically produced.
Bond, J., E. Allen, T. Capehart, and J. Hansen. 2015. Feed Outlook: Special Article: U.S. Sorghum Markets in Transition: Trade Policies Drive Export. Washington, DC: U.S. Department of Agriculture, Economic Research Service, Situation and Outlook FDS-15h-SA, August.
Gale, F. 2013. Growth and Evolution in China’s Agricultural Support Policies. Washington, DC: U.S. Department of Agriculture, Economic Research Service, Economic Research Report 153, August.
Gale, F. 2017. “U.S. Challenge of China’s Tariff-Rate Quota (TRQ) Administration System for Grains,” Paper presented at the annual meeting of the International Agricultural Trade Research Consortium: Globalization Adrift, Washington, DC, December 3–5. Available online: https://ageconsearch.umn.edu/record/266826/
Global Trade Atlas. 2018. Global Import/Export Commodity Trade Data: Chinese Customs Data. London: IHS Market, Global Trade Information Services.
Hansen, J., and F. Gale. 2014. “China in the Next Decade: Rising Meat Demand and Growing Imports of Feed.” Amber Waves. Available online: http://ageconsearch.umn.edu/record/211199
Hansen, J., F. Gale, M. Marchant, F. Tuan, F. Zhong, W. Chen, and A. Somwaru. 2015. “Difficulties in Determining the Future of China’s Commodity Trade: Policy Issues and Grain Production.” Poster presented at the joint annual meeting of the Agricultural and Applied Economics Association and the Western Agricultural Economics Association, San Francisco, California, July 26–28. Available online: http://ageconsearch.umn.edu/record/205436
Hejazi, M., and M.A. Marchant. 2017. “China’s Evolving Agricultural Support Policies.” Choices 32(2). Available online: http://www.choicesmagazine.org/choices-magazine/theme-articles/us-commodity-markets-respond-to-changes-in-chinas-ag-policies/chinas-evolving-agricultural-support-policies
International Grains Council, 2018. Supply & Demand. London, UK. Available online: http://www.igc.int/en/markets/marketinfo-sd.aspx
Patton, D. 2018, February 4. “China Launches Dumping Probe into U.S. Sorghum Imports amid Rising Trade Tension.” Reuters. Available online: https://www.reuters.com/article/us-china-us-sorghum/china-launches-dumping-probe-into-u-s-sorghum-imports-amid-rising-trade-tension-idUSKBN1FO06C
Patton, D., and T. Polansek. 2018, April 17. “China Fans Trade Dispute with Hefty Deposit on U.S. Sorghum Imports.” Reuters. Available online: https://www.reuters.com/article/us-usa-trade-china-sorghum/china-fans-trade-dispute-with-hefty-deposit-on-u-s-sorghum-imports-idUSKBN1HO0TF
Robinson, T. 2016, March 29. “Inventory Pressure Corn Price Mechanism in China to Market Pricing the Price. News Hub of Golden BRIC.” China Politics. Available online: http://www.hubgold.com/2016/03/29/inventory-pressure-corn-price-mechanism-in-china-to-market-pricing-the-price/
U.S. Department of Agriculture (USDA). 2018a. Global Agricultural Trade System. Washington, DC: U.S. Department of Agriculture, Foreign Agricultural Service. Available online: https://apps.fas.usda.gov/gats/Default.aspx
U.S. Department of Agriculture (USDA). 2018b. Production, Supply and Distribution Data. Washington, DC: U.S. Department of Agriculture, Foreign Agricultural Service. Available online: https://apps.fas.usda.gov/psdonline/
U.S. Department of Agriculture (USDA). 2018c. Quick Stats. Washington, DC: U.S. Department of Agriculture, National Agricultural Statistics Service. Available online: https://quickstats.nass.usda.gov/
Wang, H., and J. Malaga. 2016. “Potential Scenario for China’s Future Grain Sorghum Excess Demand. Paper presented at the annual meeting of the Agricultural and Applied Economic Association, Boston, Massachusetts, July 31–August 2. Available online: http://ageconsearch.umn.edu/record/235946
Wu, Q., and W. Zhang. 2016. “Of Maize and Markets: China’s New Corn Policy.” Agricultural Policy Review Fall.
Zhang, Wei. 2017. “Simulation of Chinese Sorghum Imports from a New Perspective: U.S. and Global Impacts.” MS thesis, Virginia Tech, Blacksburg, Virginia.

