Trade tensions have been escalating between the United States and China in recent months. In early April 2018, China proposed increasing import tariffs by as much as 25 percentage points on hundreds of U.S. products. These tariffs were proposed as a response to the announcement that the United States proposed tariffs on a number of Chinese imports, including steel and aluminum (as the result of U.S. 301 investigation and U.S. 232 Trade Action).
Source: Inouye (2018), USDA (2018).
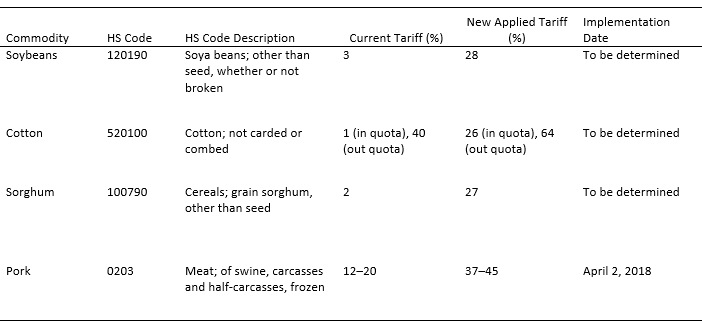
Among the most important agricultural commodities affected by China’s retaliatory tariffs are soybeans, cotton, sorghum, and pork. Table 1 presents the current and new applied tariffs for these commodities. These products are defined using the Harmonized System (HS), an international nomenclature for classifying products traded between countries. Soybeans, cotton, and sorghum are associated with unique 6-digit HS codes. China has placed retaliatory tariffs on each of these products and on various pork products. The pork tariffs differ based on the cut of meat and whether it is fresh or frozen. To capture the effects of these tariffs on the pork trade as a whole, we define pork at a more aggregate level using a more aggregate 4-digit HS code. The new applied tariff on pork was implemented on April 2, 2018, but the new tariffs on the other commodities do not have implementation dates. These will depend on further bilateral negotiation. However, the threat might become reality, as the first round of negotiation on May 4 ended with no deal and the second round of negotiation on May 18 ended with a trade war being put “on hold.”
Although quick statistics on the impacts on U.S. farmers’ losses from individual commodities have been cited in recent media reports (Muhammad and Smith, 2018; Wang, 2018), further analysis is needed. In this article, we use a partial equilibrium trade model to predict potential impacts of China’s retaliatory tariff on the U.S. farm sector for soybeans, cotton, sorghum, and pork. Our results provide timely and useful information to U.S. policy makers, producers, and other agricultural stakeholders about the breadth of impact of these retaliatory tariffs.
China is an important export market for U.S. soybeans, cotton, sorghum, and pork. Table 2 breaks down the top five exports markets for each of these products. The table lists the four commodities in descending order of export value to China, which is the top export market for U.S. soybeans and sorghum, a close second (after Vietnam) for U.S. cotton, and fifth for U.S. pork. Specifically, in 2017, the United States exported $12.4 billion worth of soybeans, $971.3 million of cotton, $835.7 million of sorghum, and $237.2 million of pork to China. In terms of trade reliance, these numbers represent 49%, 74%, 56%, and 17% of total U.S. exports and 57%, 17%, 81%, and 5% of U.S. exports to China, respectively, for the four commodities (last two rows in Table 2). This means, for example, that about half of U.S. sorghum was exported, most of it going to China. While the United States exported most of its produced cotton, only a small fraction went to China. For pork, China only accounted for 5% of U.S. exports. Although most of China’s pork imports come from the European Union, about one-fifth of China’s pork imports come from the United States, exhibiting a degree of dependence on the U.S. market. These numbers highlight the importance of the Chinese market, especially for soybeans and sorghum. Based on the table, we would expect soybeans and sorghum to be most affected by the tariff change.
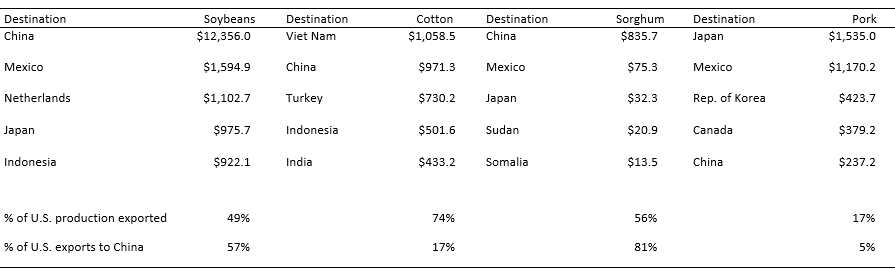
Source: UN Statistics Division - Commodity Trade (UN Comtrade, 2017).
We analyze the short-run quantitative impacts of a 25% tariff increase on U.S. domestic prices, production, exports, and welfare for all four commodities using the Global Simulation Model (GSIM). Some products, like cotton, face different tariff rates depending on how much of the product is being imported (i.e., in-quota rates versus out-quota rates). To keep things tractable, we increase the weighted average tariff rate for each product by 25 percentage points. This model employs national product differentiation, which assumes that consumers can differentiate products from different countries and allows us to simultaneously assess trade policy changes at the industry level and on a global or national level.
Francois and Hall (2003) developed the GSIM, which is now the underlying model used by the U.S. Food and Drug Administration (FDA) Regulation and Enforcement Policy Trade Impact Model project, led by the authors (a model that the FDA uses to quickly analyze the effects of potential FDA policy options on the international trade of FDA-regulated products), and the World Bank World Integrated Trade Solution (WITS) Global Tariff Cuts and Trade Simulator. Zheng et al. (2017) provide a recent application of the GSIM model to the U.S. orange juice industry, including technical details. Our results estimate the economic impacts that such tariffs will bring to the farm sector and the extent to which the federal government can adjust or respond when considering how to mitigate those impacts.
We run the GSIM for each of the four commodities by populating it with 1) United Nations trade statistics for the top 24 trading partners of the United States, 2) U.S. production data from the United Nations FAOSTAT database, 3) bilateral tariff rates obtained from the World Bank’s Trade Analysis and Information System (TRAINS) and the World Trade Organization’s Tariff Database, and 4) elasticities from the trade literature measuring the sensitivity of import demand and export supply to prices and the degree of substitution between countries (e.g., how Chinese consumers are willing to substitute U.S. pork with European pork). We select the year 2016 to make data compatible across sources. Table 3 shows the predicted impacts of the retaliatory tariffs on the United States. Using these data, our model predicts several impacts from the 25% retaliatory tariff:
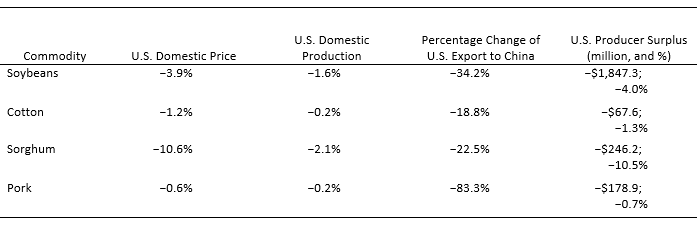
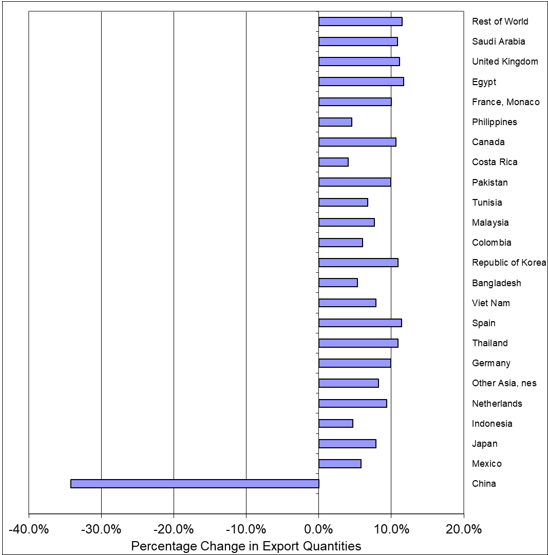
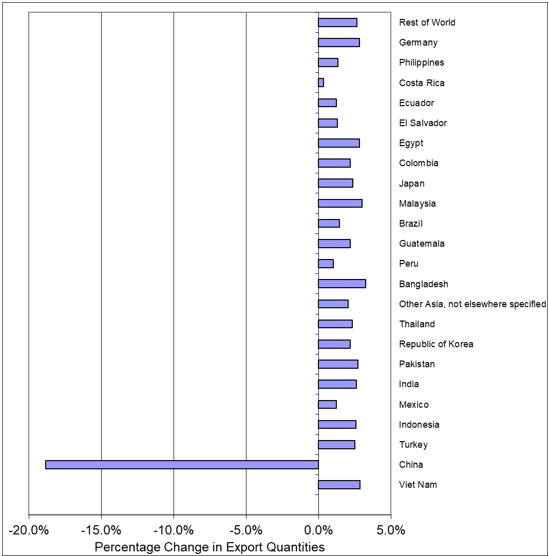
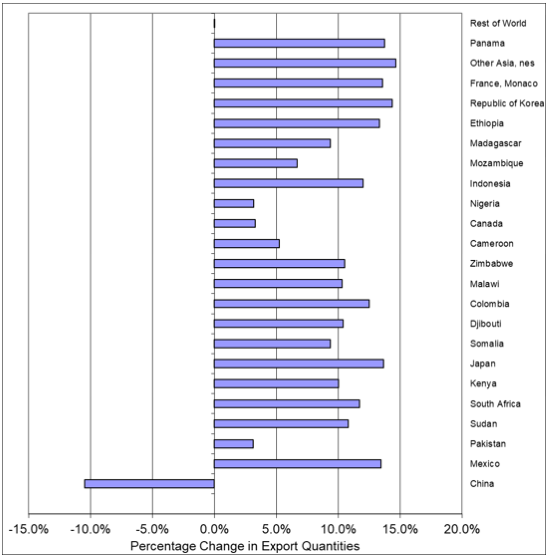
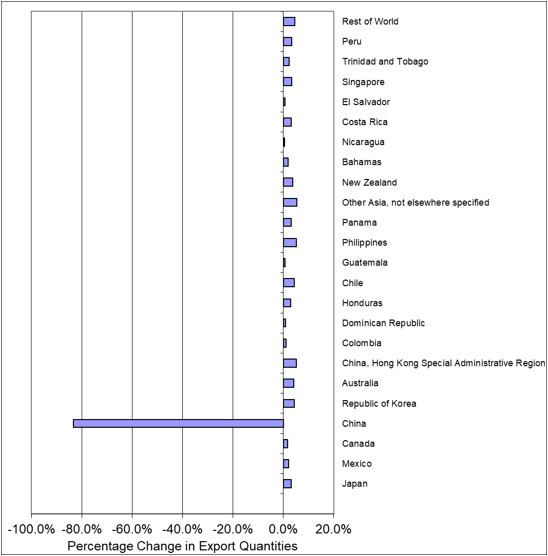
We used GSIM to predict the impact of China’s retaliatory tariffs on four major agricultural commodities—soybeans, cotton, sorghum, and pork. Based on our analysis, we predict that 1) prices of these commodities will fall by 0.6% (pork) to 10.6% (sorghum), 2) exports of these commodities to China will fall significantly (up to 83% in the case of pork), while exports to other countries will increase, and 3) U.S. producers will suffer significant losses due to the decline in exports and prices (soybean producers will lose $1.8 billion).
However, other factors may attenuate or strengthen our predictions. For example, the Chinese government has implemented policies to increase soybean planting acreage at the cost of corn acreage, a commodity for which China has accumulated a high inventory. Such policy changes may result in exports of this commodity to fall even further, which would make our predictions a conservative estimate.
Francois, J.F., and H.K. Hall. 2003. “Global Simulation Analysis of Industry-level Trade Policy.” Technical Report, Institute for International and Development Economics, Rotterdam, the Netherlands.
Inouye, A. 2018. China Imposes Additional Tariffs on Selected U.S.-Origin Products. Washington, DC: U.S. Department of Agriculture, Foreign Agricultural Service, GAIN Report CH18017, April.
Muhammad, A., and A. Smith. 2018. “Evaluating the Impact of Retaliatory Tariffs on U.S. Soybeans in China”, Available online: https://extension.tennessee.edu/publications/Documents/W532.pdf
United Nations Statistics Division. 2017. UN Comtrade. New York United Nations.
U.S. Department of Agriculture. 2018. China Responds to U.S. Section 301 Trade Action Announcement. Washington, DC: U.S. Department of Agriculture, Foreign Agricultural Service, GAIN Report CH18018, April.
Wang, H.H. “Impacts of the Tariff between U.S. and China on American Agriculture.” Purdue University Agricultural Economics Policy Briefs, PAEPB-2018_5. Available online: https://ag.purdue.edu/agecon/Pages/Purdue-Ag-Econ-Policy-Briefs.aspx
Zheng, Y., A. Sassi, M. Muth, D. Birur, S. Karns, J. Brophy, and S. Bradley. 2017. “The Role of a Production Capacity Limit in International Trade Policy Analysis.” Journal of International Agricultural Trade and Developments 10(2):167–181.

