

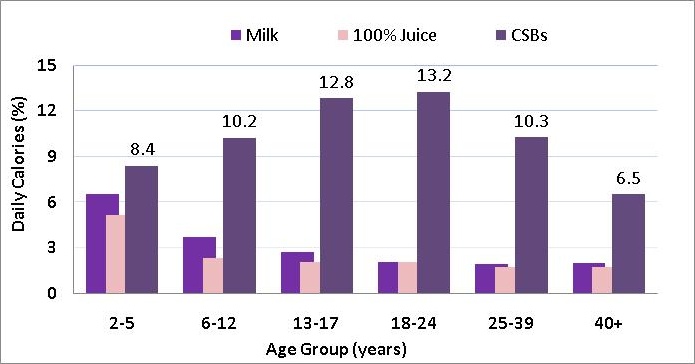
Enlightened by the success of using tobacco taxes to curb smoking prevalence, many have argued that large beverage taxes are an attractive policy tool in the fight against obesity because, unlike many other foods, calorically sweetened beverages (CSBs) have little nutritional value. However, unlike tobacco which is harmful at any level of consumption, CSBs may be consumed in moderation as part of a healthy diet. In the United States on average, CSBs make up a large share of total daily calories—about 13% for adolescents and young adults (Figure 1). Thus, reducing the consumption of CSBs may substantially reduce caloric intake, as long as individuals do not compensate by adding calories from other foods or drinks.
Existing studies of beverage demand establish that, consistent with economic theory, households do reduce the quantity of CSBs purchased in response to higher prices (Andreyeva, Long, and Brownell, 2010; Smith, Lin, and Lee, 2010; Finkelstein et al. forthcoming), which suggests that a tax-induced large increase in shelf price may be effective at reducing caloric intake. The question is how large of a tax—and in what form—is needed to cause a noticeable decline in the prevalence of overweight and obesity? An emerging body of economic research has attempted to address this question. Much previous research has referred to beverages sweetened with sugar or corn syrup as sugar-sweetened beverages. We refer to these drinks as CSBs to more accurately reflect the fact that not all contain sugar.
Although some claim that a 10% tax on CSBs would likely “…be the single most effective measure to reverse the obesity epidemic” (Frieden, Dietz, and Collins, 2010, p.358, ), a closer look at current consumption patterns and prices suggests that getting Americans to exchange CSBs for healthier low-calorie beverages or to reduce consumption of CSBs will probably take more than just a 10% tax.
CSBs—including fruit drinks, energy drinks and sweetened coffees and teas—are on average more expensive than lower calorie beverages such as diet soft drinks, bottled water, and unsweetened coffee and tea (Table 1). Yet, despite higher prices, almost all Americans consume CSBs and less than half report consuming many low-calorie alternatives (Figure 2). Fewer than 50% in all age groups report consuming any water—bottled or tap—and, except for unsweetened coffee and tea among adults age 40 and up, even fewer consume diet drinks or other low-calorie beverages.
Many states currently have special sales taxes on carbonated beverages—33 states in 2008 (Bridging the Gap, 2009). Such taxes are effective at generating revenue, but research shows that they have had little to no effect on overweight or obesity for adults or children (Powell, Chriqui, and Chaloupka, 2009; Sturm et al. 2010; Fletcher, Frisvold, and Tefft, 2010).
It is not surprising that sales taxes would have little effect on weight. First, the rates are quite low, averaging only 5.1% per taxing state (Bridging the Gap, 2009). Second, consumers may not be aware of the taxes given that sales taxes are not apparent on shelf prices. Purchase receipts generally only report the total sales tax paid, not the sales tax on each item. According to classic economic theory, assuming competitive markets and rational consumers, a sales tax should elicit the same consumer response as other forms of taxes of commensurate magnitude, and the economic incidence of the tax is the same whether it is levied on the producer or consumer. However, recent evidence suggests that consumers may not be aware of sales taxes on items in grocery stores when they are not included in the shelf price, and that the economic incidence of the tax may be dependent on whether the tax is imposed on the manufacturer, retailer, or consumer (Chetty, Looney, and Kroft, 2009).
Most current state sales taxes are applied on both caloric and diet carbonated beverages, but not on other calorically sweetened beverages such as noncarbonated fruit drinks, sports drinks, flavored milk, or sweetened coffees and teas. Consumers may avoid the tax by substituting these untaxed drinks for taxed carbonated beverages and consume the same amount of calories. Some states and localities, such as New York, have excluded or are considering excluding diet drinks and bottled water, in part to help gain industry support for the tax (Berger, 2010).
To increase effectiveness in inducing behavior change, a beverage tax should cover all types of calorically sweetened beverages, including sports drinks, flavored teas, and blended coffees. These noncarbonated beverages are increasingly popular beverages and also have a significant amount of calories per serving. Of course, consumers may increase intake of other sources of added sugar, such as cakes, cookies, and other nonbeverage sweets if these non-beverage foods become relatively cheaper in the presence of a large beverage tax.
Brownell et al. (2009) recommend a very specific tax on beverages with added caloric sweeteners—an excise tax of 1 cent per ounce. Such a tax differs from a sales tax in that the manufacturer or distributor would be responsible for paying the tax, but most importantly, part or all of the tax would be passed through as an increase in shelf prices. Chetty, Looney, and Kroft (2009) find that consumers respond less to a sales tax than they do to a tax that is included in the shelf or posted price for beer. Thus, an excise tax on CSBs may elicit a larger change in behavior than a less-apparent sales tax.
How large of a tax is necessary to have a noticeable effect on body weight such that the prevalence of overweight and obesity is reduced depends on how responsive consumers are to increasing prices—that is, the consumer price elasticity—and how a decrease in consumption of CSBs will decrease total calories consumed, and ultimately result in weight loss.
Studies that examined only carbonated soft drinks find that a 10% increase in price will reduce quantities purchased by about 8% to 10% (Andreyeva, Long, and Brownell, 2010). More recent research that considers all caloric sweetened beverages suggests that consumers may be more responsive to price. Smith, Lin, and Lee (2010) find that a 10% increase in price would reduce household purchases from grocery stores and similar outlets by about 13%. Assuming the same percentage change in intake for adults and children, they estimate that a 20% increase in the price of CSBs would decrease energy intake on average by 34 calories per day for adults and 40 calories per day for children. These daily calorie reductions could translate into a short-term decrease of up to 3.6 pounds of body weight in a year for adults and up to 4.2 pounds per year among children under the simplified assumption that a pound of fat tissue results from about 3,500 kilocalories (kcal).
One drawback to the study by Smith, Lin, and Lee (2010) is that the percentage changes in consumption for adults and children are assumed to be the same and equal to the estimated percentage changes in household-level purchases from grocery stores. Given the differences in consumption patterns between adults and children (Figure 2), it is possible that price changes will affect adults and children differently. Moreover, not all food and beverages are consumed at home, so estimates based only on purchases from grocery stores or similar outlets may overstate the actual change in consumption (Smith, Lin, and Lee, 2010).
Preliminary work by Todd, Leibtag, and Mancino (2010) uses individual consumption data from the 2003-2006 National Health and Nutrition Examination Survey and prices from the Quarterly Food-at-Home Price Database (QFAHPD) to estimate how responsive children and adult beverage consumption is to changes in prices. They find that children’s consumption is more responsive to price than adults, indicating that a beverage tax may help fight obesity among children more than among adults.
To reduce obesity and overweight, a tax on CSBs will need to result in a decrease in total caloric intake. In response to higher CSB prices, individuals may reduce calories from CSBs, but compensate by increasing caloric intake from food. Ultimately, the net effect on total caloric intake is an empirical question. Research has found that existing sales taxes have not had much effect on Body Mass Index (BMI) or overweight and obesity (Powell, Chriqui, and Chaloupka, 2009; Sturm et al. 2010; Fletcher, Frisvold, and Tefft, 2010), but this is probably due to the fact that existing sales taxes are small in magnitude and hence do not affect consumption very much.
Wendt and Todd (2010) look directly at how prices for various beverages affect children’s BMI using the Early Child Longitudinal Survey Kindergarten Class (ECLS-K) and prices from the QFAHPD. They find that an increase in the price of soda and fruit drinks can reduce children’s BMI, but significant weight reductions take at least one year to appear. A 10% increase in the price of soda would reduce BMI by 0.3% after one year and the same change in the price of fruit drinks would decrease BMI by 0.2% on average for children five to 12 years old. Relatively rough estimates using 2003-2006 NHANES data indicate that a 20% increase in the price of soda would reduce the incidence of at-risk for overweight—BMI greater than the 85th percentile for age and gender—by about 0.5 percentage points and the incidence of overweight—BMI greater than the 95th percentile for age and gender—by about 0.1 percentage points after one year among children five to 12 years old. We would expect that the effects would be larger if the tax covered all caloric sweetened beverages.
Smith, Lin, and Lee (2010) estimate larger effects. A 20% tax on all CSBs would reduce obesity among adults by three percentage points and overweight in children by 5.3 percentage points. However, their estimates likely overstate the potential impact because they assume intake declines as much as household purchases from grocery stores decrease in response to the tax. Finkelstein et al. (forthcoming) estimate more modest effects on weight—declines of about one pound per person from a 40% tax on all store-purchased CSBs. Using 2003-2006 NHANES data, we find that a weight loss of one pound per person age two years and up would decrease the incidence of obesity among adults 20 and older by 0.6 percentage points and overweight among children by 1.1 percentage points.
Taxes on food are generally regressive, so policy makers will also need to consider how a tax affects low income households. Three studies have examined the potential distributional effect of large beverage taxes across income strata. Finkelstein et al. (forthcoming) investigated the tax burden of large CSB sales taxes on households across income quartiles. Their results indicate that high-income households may bear a larger share of the total tax incidence, because high-income households purchase more branded beverages relative to low-income households who purchase more lower-cost generic drinks. In contrast, Zhen et al. (2010) and Lin, Smith, and Lee (2010) find that low-income households would pay a slightly larger share of a CSB beverage tax.
Research suggests that beverage taxes, even when relatively large—40%—will have only modest effects on weight and the incidence of overweight and obesity within one year. However, over a longer time horizon, greater declines in obesity could be achieved as American’s get out of the habit of consuming CSBs. Zhen et al. (2010) find that consumption of CSBs is habit forming, but not more so than milk. Whether or not calories from other foods, such as cookies, chips, or other “junk food,” will fill the void left from decreasing consumption of CSBs is still largely unknown. Future research should examine consumer substitutions between junk beverages and foods.
There is no question that a tax on CSBs will raise billions of dollars in tax revenue. If this money is used to help fund other obesity-reduction programs such as consumer nutrition education, the tax may be more effective than being used as a way to increase the monetary cost of consumption alone. One concern is that a large tax may hurt very low-income households, particularly those that struggle to afford enough to eat and rely heavily on CSBs as a cheap source of calories. Rising prices, even for beverages that do not meet nutritional needs other than calories, may have unintended negative effects on nutrition, particularly among low-income households.
Unlike second-hand smoke, the externality of obesity is primarily reflected through increased Medicare and Medicaid expenses. CSBs can be consumed in moderation as part of a healthful diet. A tax on all consumption penalizes those who drink these beverages in moderation.
Given that on an average day nearly 90% of the population consumes some amount of CSBs, we wonder about the political economy of a large excise tax. How likely will such large taxes be passed when over 90% of the population consumes some amount of CSBs? Attempts to pass a large CSB tax in New York State have failed twice, but per-can taxes have recently passed in Washington and Baltimore. Time will tell whether such taxes will be repealed or whether they will gain in popularity and acceptability.
It is important to remember that any tax on a specific food or group of foods can only address one small aspect of the obesity epidemic. Excessive weight is determined by caloric intake and caloric expenditure. Diet choices are the result of a complex set of household and individual decisions, reflecting not only economic factors but also social and cultural norms. Physical activity, the other side of the energy balance equation, is not likely to respond to changes in food prices. Thus, taxing CSBs may be one part of a multi-sectoral approach to tackling the problem.
Andreyeva T., Long, M.W., and Brownell, K.D. (2010). The impact of food prices on consumption: A systematic review of research on price elasticity of demand for food. American Journal of Public Health,100(2), 216-222.
Berger, J. (2010, May 19). New strategy for soda tax gives diet drinks a break. The New York Times, p A-22.
Bridging the Gap. (2009). State snack and soda tax data. Bridging the Gap Program, University of Chicago. Available online: http://www.impacteen.org/obesitystatedata.htm.
Brownell, K.D., Falrey, T. Willett, W.C., Popkin, B.M., Chaloupka, F.J., Thompson, J.W., and Ludwig, D.S. (2009). The public health and economic benefits of taxing sugar-sweetened beverages. The New England Journal of Medicine, 361(16), 1599-1605.
Chetty, R., Looney, A., and Kroft, K. (2009). Salience and taxation: Theory and evidence. American Economic Review, 99(4), 1145–1177.
Finkelstein, E.A., Zhen, C., Nonnemaker, J., and Todd, J.E. (forthcoming). The impact of targeted beverage taxes on higher and lower income households. Archives of Internal Medicine.
Fletcher J.M., Frisvold, D., and Tefft, N. (2010). Can soft drink taxes reduce population weight? Contemporary Economic Policy, 28(1), 23-35.
Frieden, T.R., Dietz, W., and Collins, J. (2010). Reducing childhood obesity through policy change: Acting now to prevent obesity. Heath Affairs, 29(3), 357-363.
Lin, B-H., Smith, T.A., and Lee, J-Y. (2010). The effects of a sugar-sweetened beverage tax: Consumption, calorie intake, obesity, and tax burden by income. Selected paper for presentation at the AAEA, CAES, & WAEA joint Annual Meeting, Denver, Colo., July 25-27, 2010.
Powell L.M., Chriqui, J., and Chaloupka, F.J. (2009). Associations between state-level soda taxes and adolescent body mass index. Journal of Adolescent Health 45(3), S57-S63.
Smith, T.A., Lin, B-H., and Lee, J-Y. (2010). Taxing caloric sweetened beverages: Potential effects on beverage consumption, calorie intake, and obesity. ERR-100, Washington, DC: U.S. Department of Agriculture, Economic Research Service.
Sturm, R., Powell, L.M., Chriqui, J.F., and Chaloupka, F.J. (2010). Soda taxes, soft drink consumption, and children’s body mass index. Health Affairs, 29(5), 1052-1058.
Todd, J.E., Leibtag, E., and Mancino, L. (2010). Would a tax on sugar-sweetened beverages reduce weight? An examination based on consumption data. Unpublished paper, Washington, D.C.
Wendt, M., and Todd, J.E. (2010). Do low prices for sugar-sweetened beverages increase children's weight? Selected poster at the AAEA, CAES, & WAEA joint Annual Meeting, Denver, Colo., July 25-27, 2010.
Zhen, C., Wohlgenant, M.K., Karns, S., and Kaufman, P. (2010). Habit formation and demand for sugar-sweetened beverages. Paper presented at the AAEA, CAES, & WAEA joint Annual Meeting, Denver, Colo., July 25-27, 2010.
| $/gallon | |
| 100% juice | 6.39 |
| Whole milk | 5.45 |
| CSBs | 4.33 |
| Low-fat milk | 3.37 |
| Diet soft drinks | 3.07 |
| Bottled water | 2.31 |
| Coffee/tea | 2.09 |
| Tap water | 0.003 |
Source: Authors' calculations using the 2006 Quarterly Food-at-Home Price Database (Todd et al. 2010)
Notes: CSBs include carbonated soda, noncarbonated fruit and sports drinks, sweetened coffees and teas, and flavored milk
