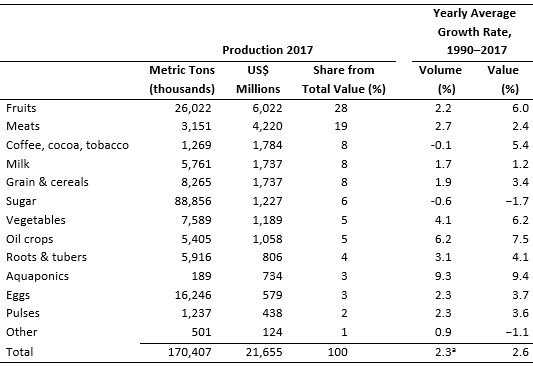
aExcluding sugar, because of its large volume compared to other commodities.
Source: Created by the authors, using data from FAO (2019).
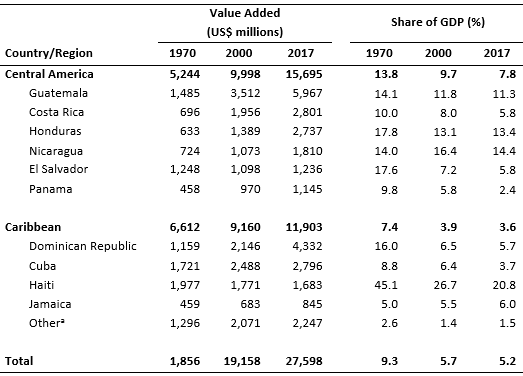
aOther Caribbean countries include the Anguilla, Antigua and Barbuda, Aruba, the Bahamas,
Barbados, Belize, the British Virgin Islands, the Cayman Islands, Curaçao, Dominican
Republic, Grenada, Guyana, Montserrat, the Netherlands Antilles (former), Puerto Rico,
Saint Kitts and Nevis, Saint Lucia, Saint Vincent and the Grenadines, Saint Maarten
(Dutch part), Suriname, Trinidad and Tobago, and the Turks and Caicos Islands.
Source: Created by the authors, using data from FAO (2019).
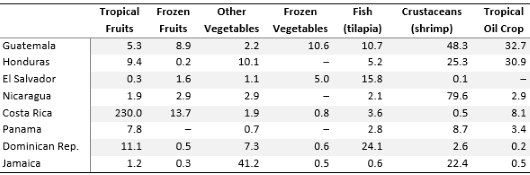
Note: For detail on estimation, interpretation, and limitations of the RCA index see Balassa
(1965) and Ding and Hadzi-Vaskov (2017).
Traditionally, the agricultural sector in Central America and the Caribbean (CAC) has played a strategic role in job creation, rural income, export promotion, and food security. For instance, the sector employs 25% of the population of Guatemala, 11% each of Costa Rica and Belize, 6% of Panama, 3.4% of the Dominican Republic, and 1.5% of Trinidad and Tobago (FAO, 2019). Such percentages are higher in rural areas, which has an average employment rate of 60%. As shown in Table 1, the CAC region produced 170.4 million tons of raw food and fiber in 2017, valued at US$21.65 billion at the farm gate.[1]
Most of that production takes place in rural areas, which are suffering from accelerated migration toward urban centers. Notwithstanding, 35% of the 93 million CAC inhabitants still live in rural areas (FAO, 2019). Further, although the value of agriculture, forestry, and fishery has increased at a rate of 1.8% per year in real terms, its relative contribution to the economy has decreased significantly as other sectors such as services and manufacturing became more dominant (Table 2).
Like most Latin America regions, the CAC region specializes in exports of natural resources and commodities, having a positive net agricultural trade balance (ECLAC, 2018a). The products responsible for this positive trade balance are vegetables, fruits, nuts, coffee, cocoa, and other minor categories. However, all Caribbean countries are net importers of ag-related products, with an aggregated trade deficit of $5.89 billion. In contrast, all countries in Central America, except for Panama and El Salvador, have a positive trade balance of those products.
Data from USDA-FAS (2019) show that the relative composition of the total value of raw food products has changed over the last 20 years in favor of those crops for which the region has a comparative advantage, such as tropical fruits and vegetables, tilapia, shrimp, palm oil, and coconut oil. Prescott et al. (1997) estimated that Honduras and Guatemala had a comparative advantage over the United States on the production of Asparagus and Cucumbers, respectively. Furthermore, the revealed comparative advantage (RCA) index (Balassa, 1965), which we calculated using 2017 export values, shows that the region has a revealed world comparative advantage in tropical products, fish, crustacean, and some oil crops (Table 3). Notice that most of the RCA estimates are above one, which indicates that those countries export more tropical fruits and vegetables, oils, fish, and shrimps than their fair share.
Data from FAO (2019) also show the dynamics of changes in the CAC region over the last 20 years. In terms of value contribution, the share of tropical fruits increased from 12% to 28%. Likewise, the share of both vegetables and oil crops increased from 2% to 5%. In contrast, the contribution of sugar, grains, and cereals decreased significantly. The share of traditional crops (e.g., banana, coffee, cocoa, sugar, and tobacco) has remained stable due to favorable prices (e.g., the price boom of 2003–2012) and the increased acreage of organic cocoa orchards in the Caribbean. To see these trends in the agricultural sector, refer to the annualized growth rate reported in Table 1, which shows that the categories of fruits, traditional crops, vegetables, oil crops, and aquaponics products have grown on average by more than 5% annually. Most of that growth for other categories, like traditional crops and fruits, was driven by price and not by volume.
Within the fruit category, pineapple production has grown the fastest during the last 20 years, overtaking bananas in terms of value. This growth has been driven mainly by Costa Rica, followed by the Dominican Republic, Panama, Honduras, and Jamaica. Other fruits that have grown significantly in terms of value are papaya and avocados (led by the Dominican Republic), specialty fruits (Costa Rica and Caribbean countries), watermelons (Costa Rica, Panama, Honduras, and Jamaica), and melons (Honduras). Mango, mangosteen, and guava production also experienced modest increases. In contrast, the production of citrus, led mainly by Jamaica, has stagnated since the year 2000.
Within the vegetable category, production of tomatoes, specialty vegetables, dry onions, chilies and peppers, and brassicas represented 80% of the total value of vegetable production during the last two decades. In 2016, the most prominent producers were the Dominican Republic, followed by Jamaica, Costa Rica, Honduras, and Panama, which together accounted for 80% of the total value of vegetable production in the region. However, countries like Nicaragua and Honduras are currently achieving the fastest-growing rates of vegetable production. The vegetable productions growing the most are eggplants, okra, lettuce, chicory, chilies, and peppers.
Most tropical oil-crop production takes place in Honduras (oil palm), Dominican Republic (coconuts), Nicaragua (peanuts), and Costa Rica (oil palm). The biggest regional player in aquaponics production is Honduras, with a 34% share, followed by Guatemala (17%), Costa Rica (13%), Nicaragua (13%), and Panama (8%).
Among traditional crops, coffee continues to be the backbone of many rural communities in Central America, especially Honduras, which is the largest producer in the CAC. From 1990 to 2012, the supply of coffee increased significantly due to the attractive prices of the coffee bean on international markets but has since declined due to La Roya (leaf rust) and low prices. Vietnam’s entrance into the coffee supply chain and overproduction in Brazil and Colombia have jeopardized the regional coffee industry. On the other hand, cocoa (mainly in the Dominican Republic) and tobacco (the Dominican Republic, Honduras, Nicaragua) production values have increased considerably during the last 20 years. The Caribbean, due to the lack of diseases for cocoa, has become the largest exporter of organic cocoa worldwide.
While the region is slowly diversifying toward other tropical agricultural products, the productivity of its agricultural output needs to continue increasing. At the aggregate level, it has increased through the total factor productivity (TFP), but not homogeneously across commodities. According to the Araujo, Feitosa, and Silva (2014), the change in TFP for selected countries of the CAC region has been positive and grew during 1990–2010. The average rise in TFP for Costa Rica, El Salvador, Guatemala, Honduras, and Nicaragua was 2.3% annually. For the selected Caribbean countries (Dominican Republic, Jamaica, Trinidad and Tobago), the average change was 1.4% annually.
Further work is required to understand TFP evolution for each specific ag-related commodity in the region. FAO (2019) data on yield per unit of land indicate that such increases have not been homogeneous across the ag sector. During 1990–2017, yields per hectare increased by 62% on average, calculated from a list of 83 regional products. Although some products (such as chilies, peppers, okra, papayas, watermelon, lettuce, and onion) have enjoyed more than three-digit growth in yield per hectare during that period, many others have lagged (such as coffee, cocoa, sugar cane, melon, banana). Country and regional efforts are required to continue increasing productivity through research, extension, and public investment.
According to the Economic Commission for Latin America and the Caribbean (ECLAC) (2014), several factors drive regional agricultural output growth. The first is external demand for agricultural products, which is highly linked to the economic cycles of regional trading partners. For example, during the 2008–2009 financial crises, some agricultural exports were affected by lower demand in the United States. Similarly, during the last 10 years, the CAC region has benefited from strong U.S. demand for manufacturing and ag-related products (ECLAC, 2018b). The second driver refers to the international price of exportable commodities and importable inputs such as fertilizer and feeds. Heavy dependence on a reduced number of commodities puts the agricultural sector of some countries at risk. For example, most rural producers in Honduras depend on the price of coffee, which is currently low by historical standards. Thus, efforts to diversify the production and export of tropical agricultural products should be a priority for the region. Although the composition has slightly changed, the region still depends on traditional crops such as bananas, sugar cane, coffee, and cocoa. Additionally, price premiums and specialized markets could be targeted through product differentiation via international production and management practice certifications. The third output growth driver is credit access and government support of agriculture. In particular, the lack of affordable credit options and risk protection against natural disasters—such as hurricane, flooding, and drought—make CAC producers relatively less competitive and more vulnerable to exogenous events compared to their northern and southern counterparts.
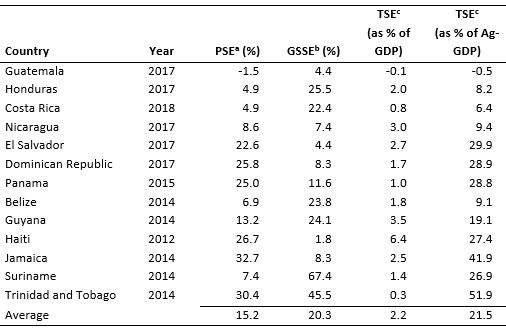
aPSE = Producer support estimate; it indicates the percentage of farm revenue due to
ag policies.
bGSSE = General service support estimate; it indicates the level of support to farmers
through services such as extension, research, infrastructure development, ag-health,
export promotion, among others.
cTSE = Total support estimate; it indicates the support to the ag-sector with respect to
GDP or agricultural GDP.
Source: IDB Agrimonitor database.
According to the Interamerican Development Bank (IDB) Agrimonitor database, the average government support to agriculture in the CAC region is around 15.2% of farmers’ total receipts (Table 4), comparable to the support provided by Organization for Economic co-operation and Development (OECD) countries (18%) and higher than average for Latin America and the Caribbean (3.29%) (Egas and de Salvo, 2018). However, around 80% of this support comes from Market Price Support (MPS) [2] and direct support, which have more distorting effect than other types of support. Notwithstanding, the region has been shifting toward more neutral support due to several free trade agreements signed across the region and with other nations and blocs.
The total support estimate (TSE) as a percentage of total gross domestic product (GDP) indicates the relative importance that governments assign to the agricultural sector (Egas and de Salvo, 2018). On average, CAC countries dedicated 2.2% of their GDP to supporting agriculture. This estimate is usually higher for countries—such as Haiti, Guyana, Nicaragua, and Jamaica—with low per capita GDP, a large rural population, considerable food insecurity, and high rural unemployment.
Further, empirical evidence indicates that support to general services (e.g., infrastructure development, marketing, promotion, public goods investments, extension, research, subsidized credit, risk coverage tools) have more impact on agricultural development than market price support or direct support (Anríquez et al., 2016). During the period of analysis, the support to general services (GSSE) was only 20% on average. The countries that could benefit the most from increasing the GSSE are Haiti, El Salvador, Guatemala, and Jamaica, which have GSSE shares below 10% relative to the PSE. Lopez and Galinato (2007) suggest that a 10-percentage-point increase in GSSE, holding everything else constant, could lead to a 5% increase in per capita agricultural value added.
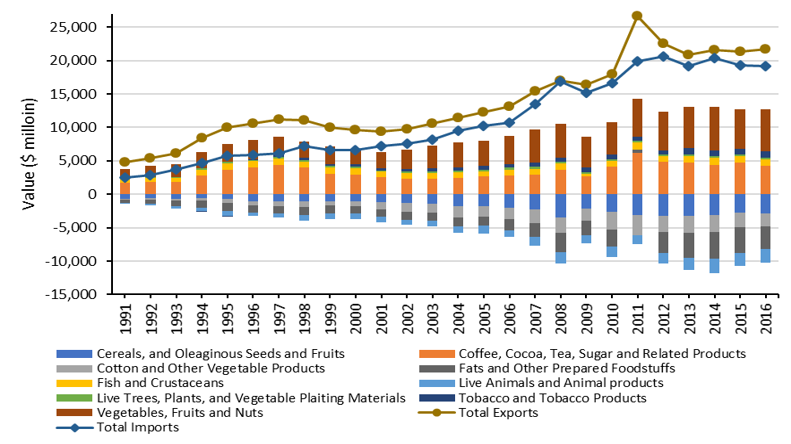
Notes: Data include Harmonized Tariff Schedule Chapters 1–21, 23, 24, and 52
(US ITC, 2019). Additional differences in import and export values are due to
differences in reporting practices among trade partners. Vertical bars represent the
trade balance by product category.
Source: Prepared by authors, using data from USDA FAS Global Agricultural Trade
System.
Its geographical location, tropical climate, existing production capabilities, and political treaties define the international trade of agricultural products from the CAC region. Several trade agreements support regional bilateral and multilateral commerce (WTO, 2019). The Central American Common Market (CACM), Caribbean Community and Common Market (CARICOM), and the Dominican Republic–Central America Free Trade Agreement (CAFTA-DR) are the main trade agreements promoting intra-regional trade. Multiple individual and regional trade agreements have also been signed with the European Union and individual countries in North America, South America, and Asia. Foreign trade is a pillar of the regional economy. In 2018, Central America and the Caribbean exported $30.2 and $9.8 billion worth of agricultural and ag-related goods, which represent a share of 59% and 28%, respectively, from total exports (USDA-FAS, 2019).
As shown in Figure 1[3], the value of agricultural product exports has experienced a four-fold increase since 1991, with over 41% growth in the past decade. Imports of agricultural products have also increased. In 2016, the CAC imported about $19.16 billion in agricultural products. Historically, the agricultural sector in the CAC has had a positive trade balance, with an average annual trade surplus of $2.67 billion between 1991 and 2016. In terms of product categories, the CAC is a net exporter of tropical products such as vegetables, fruits, and nuts; coffee, cocoa, tea, sugar and related products; fish and crustaceans; tobacco and tobacco products; and live trees, plants, and vegetable-planting materials. In 2016, these commodities generated a total trade surplus of $12.75 billion. However, the region is a net importer of cereals and oleaginous seeds and fruits; live animals and animal products; cotton and other vegetable products; and fats and other prepared foodstuffs.
Notes: Data include Harmonized Tariff Schedule Chapters 1–21, 23, 24, and 52 (US ITC, 2019).
Additional differences in import and export values are due to differences in reporting practices
among trade partners.
Source: Prepared by authors, using data from USDA FAS Global Agricultural Trade System.
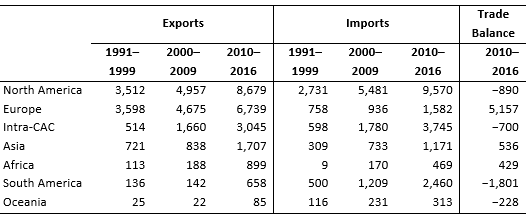
CAC agricultural products are traded worldwide (Table 5). North America is the major export destination, with an average annual value of $8.68 billion between 2010 and 2016, followed by Europe ($6.74 billion) and intra-regional trade ($3.045 billion). An additional $3.35 billion worth of agricultural products were exported annually to Asia, Africa, South America, and Oceania during the same time. The distribution of imports differs, with North America, Intra-CAC, and South America being the leading suppliers of agricultural products to the region (Table 5). An annual average of $15.78 billion was imported from these territories during 2010–2016, representing about 82% of the total imports. In terms of the trade balance, the CAC consistently has a trade surplus with Europe, Asia, and Africa but a growing deficit with South America, North America, and Oceania.
Because of the uncertainty of commodity prices and weather, the dependence of low-income CAC countries on a few agricultural commodities represents a risk for their foreign exchange earnings, rural stability, and growth (DeRosa, 1992; Hesse, 2008). The region still depends heavily on exports of traditional crops (e.g., banana, coffee, cocoa, sugar, tobacco). However, such dependence has decreased during the last 30 years, from 69% to 43%. The dependence on traditional crops varies from country to country. In Central America, Panama and Honduras are most dependent on traditional crops, which make up over 50% of their exports. El Salvador and Costa Rica have done the most to reduce such dependence, which has dropped from about 90% to only 40% of total ag-related exports. In the Caribbean, dependence on sugar, coffee, and tobacco has decreased, but reliance on organic and fair-trade banana and cocoa exports has increased.
Agricultural production and exports play a strategic role in creating jobs, bringing in rural income, and guaranteeing food security for the 31.8 million people living in the region’s rural areas. Empirical evidence indicates that agricultural growth significantly helps reduce poverty in rural areas, even more than growth in other sectors of the economy (Ravallion and Datt 1996; Kakwani, 1993; Thorbecke and Jung, 1996; Khan, 1999; de Janvry and Sadoulet, 2002; Anríquez and López, 2007).
Current interventions in agriculture rely on protectionist agricultural policies and lack of investment. Governments should work towards better-targeted intervention policies. For example, the region should continue restructuring agricultural government support toward general services, such as infrastructure development, marketing and promotion of the national products, extension, research, easy access to credit, and weather-risk protection. Support to general services is still below 10% with respect to the producer support estimates. Empirical evidence by Anríquez et al. (2016) suggests that a 10-percentage-point increase on GSSE, holding total expenditures constant, would lead to a 5% increase in per capita agricultural value-added. This type of intervention would have a much greater impact on growing agricultural production and export than the current support through market prices.
The value of agriculture, forestry, and fisheries has increased at a rate of 1.8% per year in real terms. Its relative composition of the total value of raw food products at the farm gate has changed over the last 20 years in favor of those crops for which the region has a comparative advantage. The agricultural categories that have grown the most are fruits, vegetables, oil crops, and aquaculture products. Those categories have grown on average by more than 5% annually since the 1990s.
Foreign trade has been fundamental to the growth of the CAC agricultural sector. Historically, the region has a positive trade balance in terms of agricultural products. In 2016, $21.69 billion in agricultural commodities were exported compared to the $19.16 billion imported. The CAC excels in the export of tropical products (e.g., vegetables, fruits, coffee, sugar, aquaculture products, tobacco, etc.) but has a deficit in the production of cereals, oil crops, animal products, cotton, and fats. The biggest commercial partner is the United States, which benefits from diversified year-round tropical fruit and vegetable imports. In the last 20 years, the export of tropical fruits and vegetables from the region not only increased in volume and value but in diversity as well. For instance, the tropical products exported to the United States increased by 12% over 2000–2018 (USDA-FAS, 2019). The proximity and preferential access of most CAC countries to the U.S. market offer a unique opportunity for the region to continue increasing exports. Further, the CAC should take advantage of its privileged tropical position to increase the variety of fruits and vegetables produced to reduce dependence on a limited array of commodities.
Anríquez, G., W. Foster, J. Ortega, C. Falconi, and C. P. de Salvo. 2016. “Public Expenditures and the Performance of Latin American and Caribbean Agriculture.” IDB Working Paper Series Nº IDB-WP-722 IDB-WP-722. Washington, DC: Interamerican Development Bank.
Anríquez, G., and R. López. 2007. “The Effect of Agricultural Growth on Poverty in an Archetypical Middle-Income Country: Chile in the 1990s.” Agricultural Economics 36(2): 191–202.
Anríquez, G., and K. Stamoulis. 2007. “Rural Development and Poverty Reduction: Is Agriculture Still the Key?” Journal of Agricultural and Development Economics 4(1): 5–46.
Araujo, J.A., D.G. Feitosa, and A.B.D Silva. 2014. Latin America: Total factor Productivity and its Components, CEPAL Review, 114, 51-65.
Balassa, B. 1965. “Trade Liberalization and “Revealed” Comparative Advantage.” Manchester School 33: 99–123.
DeRosa, D.A. 1992. “Increasing Export Diversification in Commodity Exporting Countries: A Theoretical Analysis.” International Monetary Fund Staff Papers 39(3): 572–595.
Ding, X., and M. Hadzi-Vaskov. 2017. “Composition of Trade in Latin America and the Caribbean.” Working Paper 17/42. Washington, DC: International Moneraty Fund.
Egas Yerovi, J.J., and C. Paulo de Salvo. 2018. Agricultural Support Policies in Latin America and the Caribbean. A Review. Washington, DC: Inter-American Bank of Development.
Food and Agriculture Organization of the United Nations (FAO). 2019. FAOSTAT Statistical: Database. Rome, Italy: FAO. Available online: http://www.fao.org/faostat/en/#data/RF.
Hesse, H. 2008. “Export Diversification and Economic Growth”. Working Paper 21. Washington, DC: Commission on Growth and Development.
Interamerican Development Bank. 2019. IDB Agrimonitor: Database. Available online: http://agrimonitor.iadb.org/en. [Accessed August 25, 2019).
de Janvry, A., and E. Sadoulet. 2002. “World Poverty and the Role of Agricultural Technology: Direct and Indirect Effects.” Journal of Development Studies 38(4): 1–26.
Kakwani, N. 1993. “Poverty and Economic Growth with Application to Côte d'Ivoire.” Review of Income and Wealth 39(2): 121–139.
Khan, H.A. 1999. “Sectoral Growth and Poverty Alleviation: A Multiplier Decomposition Technique Applied to South Africa.” World Development 27(3): 521–530.
Lopez, R., and G. Galinato. 2007. “Should Governments Stop Subsidies to Private Goods? Evidence from Rural Latin America.” Journal of Public Economics 91(5): 1071–1094.
Prescott, L., G.C. Rausser, M.B. Sigler, and J. Arnone. 1997. “A Dynamic Comparative Advantage Analysis of Fresh Fruit and Vegetable Trade between Latin America and the United States.” GATT Research Papers 8. Ames. IA: Iowa State University. Available online: http://lib.dr.iastate.edu/gatt_papers/8
Ravallion, M., and G. Datt. 1996. “How Important to India's Poor Is the Sectoral Composition of Economic Growth?” World Bank Economic Review 10(1): 1–25.
Thorbecke, E., and H.-S. Jung. 1996. “A Multiplier Decomposition Method to Analyze Poverty Alleviation.” Journal of Development Economics 48(2): 279–300.
UN Economic Commission for Latin America and the Caribbean (ECLAC). 2014. Evolución del Sector Agropecuario en Centroamérica y la República Dominicana, 1990–2014. Publication LC/MEX/L.1175. México City, México: Comisión Económica para América Latina y el Caribe (CEPAL).
UN Economic Commission for Latin America and the Caribbean (ECLAC). 2018a. Foreign Direct Investment in Latin America and the Caribbean. Publication LC/PUB.2018/13-P. Santiago, Chile: ECLAC.
UN Economic Commission for Latin America and the Caribbean (ECLAC). 2018b. International Trade Outlook for Latin America and the Caribbean. Publication LC/PUB.2018/20-P., Santiago, Chile: ECLAC.
United State Department of Agriculture. 2019. USDA FAS Global Agricultural Trade System: Database. Available online: https://apps.fas.usda.gov/gats/default.aspx?publish=1 [Accessed August 25, 2019).
U.S. International Trade Commission. 2019. Harmonized Tariff Schedule of the United States 2019. Revision 12. Washington, D.C.
World Trade Organization (WTO). 2019. Regional Trade Agreements: Database. Available online: http://rtais.wto.org/UI/publicPreDefRepByCountry.aspx [Accessed June 26, 2019).
[1] The Caribbean countries considered to construct Table 1 include the Antigua and Barbuda, the Bahamas, Barbados, Belize, Dominica, the Dominican Republic, Grenada, Haiti, Jamaica, the Netherlands Antilles, Puerto Rico, Saint Kitts and Nevis, Saint Lucia, Saint Vincent and the Grenadines, and Trinidad and Tobago.
[2] Example of MPS are tariff, quotas, and specific duties.
[3] Based on data availability, the Central America and the Caribbean trade estimates are based on the trade values reported by the following countries: Anguilla, Antigua and Barbuda, the Bahamas, Barbados, Belize, Bermuda, the British Virgin Islands, the Cayman Islands, Costa Rica, Cuba, Curaçao, Dominica, the Dominican Republic, El Salvador, Grenada, Guadeloupe, Guatemala, Haiti, Honduras, Jamaica, Martinique, Montserrat, Nicaragua, Panama, Saint Lucia, Saint Vincent and the Grenadines, Saint Kitts and Nevis, Saint Maarten, Trinidad and Tobago, and the Turks and Caicos Islands.

