The region that we refer to as the Andean countries includes five South American nations—Colombia, Ecuador, Peru, Bolivia, and Chile—which share not only the longest continental mountain range in the world (the Andes) but also strong historical and commercial ties. The first four currently comprise the Andean Community (Comunidad Andina, CAN), a free-trade bloc created in 1969. Chile also was a full member but withdrew in 1973, but it still participates as an associate member (CAN, 2019). With growing populations and economies, a combined gross domestic product (GDP) of over $1 trillion, and vast, valuable land and water resources, the region is an important agricultural player in global trade.
Despite shared geography and history, economic and political conditions differ across these five countries. Their heterogeneous climates and natural resources have also led to different developments in their agricultural sectors. We review the status of and trends in the Andean region’s agricultural sector, with special emphasis on agricultural trade issues.
In 2017, approximately 127 million people—20% of the population in Latin America and the Caribbean—lived in the Andean countries: 49.1 million in Colombia, followed by 32.3 million in Peru, 18.1 million in Chile, 16.6 million in Ecuador, and 11.1 million in Bolivia (World Bank, 2019). Average per capita GDP across the region was $7,600 in 2017, with some variability across countries, ranging from $3,394 in Bolivia to $15,347 in Chile. The region experienced average annual growth rates (in real per capita GDP) of approximately 2%–3% from 2000 to 2017, an overall increase of approximately 60%.
The diversity of agricultural production in the Andean countries is related to the variety of climate zones, which include tropical, temperate, arid, and cold (National Geographic, 2019). The tropical climate zone is located primarily in the Amazon River basin, the largest basin in the world, which covers large parts of Colombia (30% of the country’s total area), Ecuador (51%), Peru (75%), and Bolivia (66%) (FAO, 2015). Forestry and extensive cattle production are the principal agricultural activities in this zone, but commercial crops include coffee, sugarcane, cocoa, palm oil, and banana-growing areas, particularly in Ecuador and Colombia. Rice, cassava, maize, and beans are grown for subsistence (OEC, 2019; FAO, 2015).
At midlevel elevations, temperate climates extend to the south of the Tropic of Capricorn in Chile (National Geographic, 2019). Corn is produced widely in this agro-ecological zone, and vegetables and cut flowers have recently become major agricultural export industries in Ecuador and Colombia (Knapp, 2015).
Arid climates, both cold and extremely hot, occur in coastal deserts and at high elevations in the Andean interior. Although arid conditions make agricultural production difficult, irrigation has allowed crop plantations to expand in these zones (National Geographic, 2019; Gestion, 2019).
Cold climates are found in southern Chile and at the highest elevations. Even though this climate zone is not optimal for agricultural production, native potato species and grains like quinoa are grown there. Sheep and native grazing animals—such as llamas, alpacas, and vicuñas—also are raised in cold climates (National Geographic, 2019).
Agriculture, forestry, and fisheries contributed 7.6% to the Andean countries’ GDPs in 2017, above the Latin American average of 4.7% (World Bank, 2019). More importantly, the sector accounts for approximately 22% of jobs in the region (range 11%–30%). Over the past decade, growth in agricultural GDP (3.2%) was above total GDP growth (2.8%) (World Bank, 2019). In spite of the fact that the agricultural sector remains an important component of the Andean countries’ economies, high levels of rural poverty, estimated to be between 35% and 58%, still affect agricultural households and laborers in the region (World Bank, 2019).
Land holdings are generally concentrated in the hands of large private owners. According to the FAO (2014), agricultural units with 50 or more hectares own 75% of agricultural land but account for only 8% of total farms. In contrast, agricultural units of 5 or fewer hectares account for 57% of farms but own only 4% of land. The FAO report excludes Bolivia, but the situation is similar or even more pronounced there (Paz Ballivián, 2004).
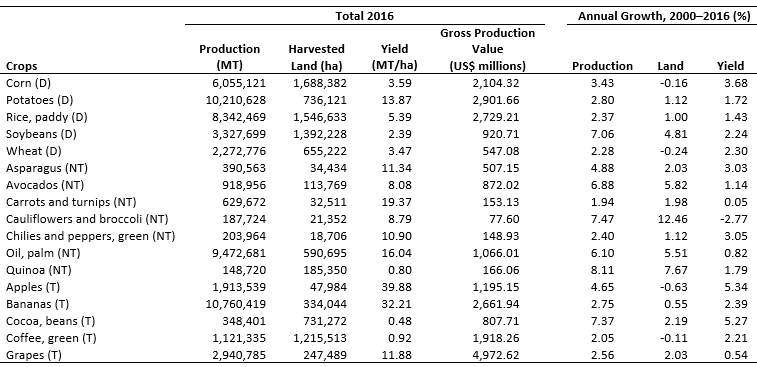
Notes: D indicates crops for domestic/regional markets; NT indicates nontraditional export crops;
T indicates traditional export crops.
Source: FAO (2019).
Between 2000 and 2016, regional agricultural output and productivity increased for a majority of agricultural products, but rates of growth vary across countries and products (FAO, 2019). We consider 15 crops, chosen based on their importance to export markets, although we also include certain key crops for domestic consumption. Broadly speaking, these crops can be classified into three groups: nontraditional export crops, traditional export crops, and crops for domestic/regional consumption (see Table 1). These crops cover an area of approximately 9.5 million hectares, or about 80% of the region’s arable land.
Nontraditional exports had the highest average annual rates of increase in production and land harvested (5.4% and 5.2%, respectively). Moreover, with the exception of carrots, turnips, chilies, and peppers, all crops in the group have average annual rates of increase in production above 4.8%. Historically, Peru has been the main producer of asparagus, avocado, and quinoa, while Ecuador leads in production of cauliflower and broccoli and Colombia is the primary producer of carrots and turnips. Within countries, Ecuadorian production of quinoa, cauliflower, and broccoli has grown quickly (more than 20% annually). Meanwhile, Peru has also experienced high levels of growth (approximately 10%) in the production of avocado, cocoa, and quinoa. Growing demand for these crops—particularly those, such as the “superfood” quinoa, with high nutritional value—in international markets accounts for these crops’ higher output levels in the region.
Representing nearly four times the area devoted to nontraditional export crops in 2016, the annual production of traditional export crops has grown at a lower rate on average (3.9% for the group as a whole). Given the region’s leading status in the production of some of these crops (e.g., bananas, grapes, and coffee), their production has continued to grow despite well-established international markets and export competition from other regions. Most of the expansion in these crops’ production has derived from increases in productivity rather than expansion in land (see Table 1). Colombia and Peru are the leading regional producers of coffee (Colombia is the third largest producer and exporter worldwide). Ecuador leads cocoa production, followed by Peru. Chile is the largest producer of apples and grapes, while Peru is second in both crops. Ecuador and Colombia leads banana production, both regionally and worldwide: Ecuador is the largest exporter in the world (24% of total world exports) and Colombia is sixth largest (6.4%). However, the spread of fusarium wilt tropical race 4 (TR4), which has destroyed crops in Asia, Australia, and Africa, threatens Andean banana production. In August 2019, Colombia confirmed the disease’s presence in the Americas and declared a national emergency (Lambert, 2019).
The five crops intended for the domestic Andean market account for 65% of cultivated area. Despite being produced only for domestic markets, their total production has also expanded—albeit at a lower rate than that of export crops—in addition to increases in the imports of these crops. The growth in production of crops for the Andean market can mainly be attributed to improvements in productivity stemming from the adoption of modern agricultural technologies, including new varieties and the use of fertilizers and pesticides (Table 1), driven in large part by competition from cheaper imports. Colombia and Peru are the main producers of rice, potatoes, and maize, all regional staple foods. Chile dominates wheat production, and Bolivia leads in regional production of soybeans, which are exported primarily to Colombia and Peru (Tridge, 2019).
Animal production in the region, also largely for domestic consumption, experienced important increases in the production of chicken and pork (average annual growth rates of 6% and 4.5%, respectively) from 2000 to 2016. Beef production experienced only a very modest increase (1%), although most of the agricultural land in the region (approximately 110 million hectares) corresponds to permanent meadows and pastures (FAO, 2019). Imports of animal products have also expanded; therefore, there has been room for growth in both internal production and imports to respond to the increased domestic demand for animal protein as the economy and household income grow. Colombia leads regional chicken and beef production, and Chile is the main producer of pork. The region as a whole also has experienced increases in the productivity of meat production. However, productivity changes have been uneven across commodities and countries (FAO, 2019). Colombia is the principal regional producer of milk; regional milk production has increased relatively slowly, with an average annual growth rate of 1.2%; productivity growth also has been very slow. Overall, the animal sector in the region seems to be less dynamic than the crop sector.
Despite the high specialization in the export of raw agricultural commodities, wine is an important processed agricultural product from the region. Production has increased significantly, particularly since 2010 (5% annual growth rate). Chile is the leading regional producer and the fifth-largest exporter in the world.
Agricultural policies in the Andean region also vary, with the dual objectives of promoting exports and domestic production of products that can compete with imports. Market price support policies (e.g., tariffs or quotas that prevent imports and increase domestic prices) have been implemented principally in Colombia, Bolivia, and Ecuador. Direct payments to farmers (e.g., because of market price volatility or adverse weather events) and investment in infrastructure and public goods (e.g., irrigation, agricultural research, plant and animal inspection, etc.) are important in both Peru and Chile. Subsidies for farms’ variable inputs are important in Chile (Egas and De Salvo, 2018).
Chile was the first country to implement domestic free market and open trade policies, such as the Free Trade Agreements (FTA), with the largest world economies, including the United States, European Union (EU), Japan, Canada, and China. Increased efficiency in its agricultural export base attributable to these policies catapulted the country into its current position as a leading exporter of fresh fruits and wine that benefited from the counter-seasonal production patterns with respect to the Northern Hemisphere. Peru followed suit through land privatization policies and market-oriented schemes, signing the FTA and sanitary protocols with the same leading world economies during the 1990s and 2000s. Further, the country embarked on a series of extensive irrigation projects in coastal areas that incorporated thousands of acres for modern, export-oriented crops. Private investment and the use of modern production technologies helped Peru acquire increasing market shares in the high-value U.S. and EU produce markets. Colombia followed a similar pattern. In 2011, these three countries joined Mexico to form a free trade–oriented area referred to as “Alianza del Pacífico” (Alianza del Pacifico, 2018). After years of domestic-focused policies, Ecuador seems to be redirecting its economic system similarly and has requested admission to this group. In 2018, Chile and Peru also signed the Comprehensive and Progressive Trans Pacific Partnership (CPTPP) agreement, negotiated previously as TPP, which includes nine other Pacific Rim countries. Bolivia, rich in natural resources, trails the remainder of the Andean countries in agricultural trade, except for the eastern soybean production area of Santa Cruz de la Sierra.
Note: Elaboration by authors from UN Comtrade (2019).

Elaboration: Authors. Data from USDA (2019).
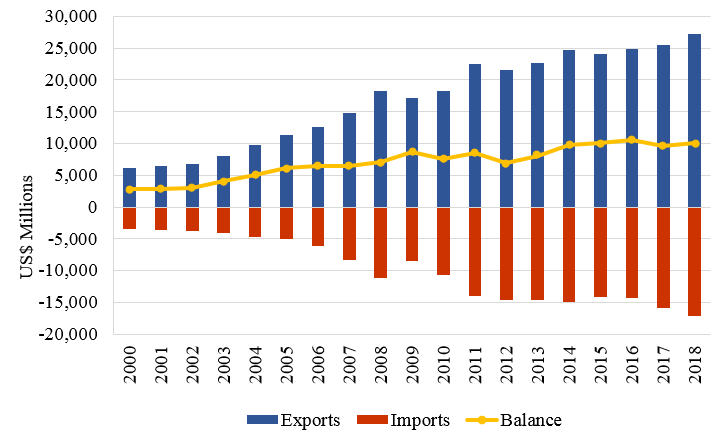
From 2000 to 2018, the region’s strong population and per capita income growth, combined with middle-class expansion and openness to trade, resulted in a fast-growing market for agricultural products, particularly for U.S. commodities such as wheat, soybean products, corn, rice, poultry, pork, and beef, despite competition from other South American countries, principally Brazil and Argentina (Figure 1) (Gao, 2015).
Overall, the Andean region' (as defined above, excluding Venezuela) had a growing trade surplus with the rest of the world during the 2000–2018 period, increasing from $5 billion in 2000 to approximately $15 billion in 2018 (UN Comtrade, 2019). Agricultural regional exports (excluding intra-regional trade) quadrupled, from approximately $6 billion to $26 billion, with the United States as the single largest export market (approximately 28% in 2018) and China as a distant, but rapidly growing, second destination (9% in 2018). However, the EU, as a bloc, also is a very important trade partner, accounting for approximately 30% of the Andean region’s exports (Figure 1).
Agricultural net imports to the region expanded from approximately $3 billion in 2000 to over $12 billion in 2018 (UN Comtrade, 2019). The United States was not only the largest source of imports but also increased its share of imports to the region, from 28% to 34%, with Argentina a close second. The EU share accounted only for approximately 10% of agricultural imports. Considering agricultural imports and exports combined, the United States is the region’s most important trade partner. In aggregate, U.S. agricultural exports to the Andean region not only have increased in value, but also in importance (USDA, 2019). The value of U.S. exports to the region increased 6.4 times, from $0.9 billion in 2000 to $5.5 billion in 2018, while the value of total U.S. agricultural exports to the world and to Latin America (as a whole) grew by only 2.2 times and 3.2 times, respectively (see Figure 2). Colombia represents more than one-third of the region’s agricultural imports from the United States, followed by Chile and Peru.
Agricultural imports from the Andean region to the United States also have expanded, increasing from $2.8 billion to $9.5 billion (2000 to 2018), largely because of produce imports from Chile and Peru but also from increased imports of coffee, flowers, and bananas from Colombia and Ecuador (Figure 2) (USDA, 2019). Despite the increase in import value, the share of U.S. agricultural imports from this region declined slightly, from 22% to 20%, because of Mexico’s growing contribution. Overall, balance of U.S. agricultural trade with the region has been negative, increasing from −$2.2 billion in 2000 to −$3.5 billion in 2018; and in some cases, the region became a serious competitor for U.S. produce exports, particularly grapes and berries (Figure 2).
Oilseeds and corn are the Andean region’s leading imports from the United States, followed by wheat, pork, dairy, and poultry, in that order, with beef and rice following (USDA, 2019). Imports of U.S. oilseeds and products (mainly soybeans) reached nearly $1.4 billion by 2018, a 12-fold increase from 2000, compared with a three-fold increase of U.S. exports to the world. Colombia’s share of the region’s imports from the United States reached nearly 60%, followed by Peru. Similar trends can be observed in the value of U.S. corn exports to the Andean region, which reached $1.4 billion in 2018, seven times 2000 values, and are exported almost exclusively to Colombia and Peru. U.S. wheat exports to the region reached a value of $400 million in 2018, a two-fold increase from 2000.
Pork and dairy were first among U.S. animal protein exports to the Andean region in 2018, at approximately $300 million each, representing increases of 40 and 12 times relative to 2000 values, respectively. Colombia is by far the largest regional importer of pork products, while Colombia, Peru, and Chile account for similar shares in dairy product imports. Andean imports of poultry from the United States ($230 million in 2018) also grew rapidly, and Ecuador has become the largest regional importer of U.S. poultry. While still smaller in value and importance, beef and veal imports from the United States have increased rapidly as well; Colombia is by far the largest importer, followed by Chile. Finally, U.S. rice exports to the region are still very small in value and highly variable (less than $60 million in 2018) and exported primarily to Colombia. With the exception of wheat and rice imports, the fast-growing demand for other agricultural products from the United States seems to be driven by Andean consumers’ demand for animal protein that domestic production alone cannot meet.
Historically, U.S. agricultural imports from the Andean region consisted of products like coffee, cocoa, bananas, flowers, and tropical fruits (USDA, 2019). More recently, given strong U.S. demand for fresh fruits and vegetables and the FTAs the United States has signed, its imports have increased and diversified considerably. The value of U.S. imports of fruits and preparations from the Andean region reached $4.1 billion in 2018, 3.6 times the value of imports in 2000. Chile and Peru have expanded fruit exports to the U.S. market considerably. While Chile exported 4 times the 2000 value in 2018, Peru’s fruit exports grew exponentially (70 times) during the same period, and Ecuador was the third-largest fruit exporter to the United States.
Avocados, grapes, mangoes, bananas, and berries are among the top fruits exported to the United States. Grapes, primarily from Chile and Peru, reached a trade value of $1.1 billion in 2018, an almost three-fold increase since 2000. Although most grapes are imported from Chile, grape exports from Peru went from 0 in 2000 to nearly 50% of the Chilean shipments to the United States in 2018. Peru produces grapes on newly irrigated land, where two harvests a year are possible (Redagricola, 2017).
The region trails just behind Mexico as a source of U.S. avocado imports, one of the fastest-growing U.S. imports. Even though the $240 million in 2018 represents only 10% of U.S. imports from Latin America (where Mexico is the largest exporter), Chile was the only South American country that exported to the United States until 2010, when Peruvian avocado imports were allowed into the United States. By 2018, U.S. avocado imports from Peru almost tripled the value of those from Chile. Again, newly irrigated land on the Peruvian coast has provided most of the avocado export supply. Colombia also began avocado production and exports with Chilean and Peruvian investors there.
Although less than half the value of fruit imports, U.S. imports of vegetables and preparations from the Andean region have grown consistently, reaching $760 million in 2018, 7 times the 2000 values. While most of these imports are from Peru (75%), Ecuador has consistently expanded its supply and reached second place in the region. This import category’s largest representative has been asparagus, but onions, peppers, and other minor vegetables have also increased in value. Whereas most of the U.S. imports come from the region’s coastal and moderate climate areas, in recent years, imports of quinoa from high-altitude regions of Peru and Bolivia have expanded, but these still represent a relatively small value of total imports ($35 million in 2018).
Finally, U.S. imports of other traditional crops from the Andean region (flowers, cocoa, coffee, bananas, and palm oil) have also increased, totaling $3,163 million in 2018, almost double 2000 values. However, their relative importance as a share of total U.S. imports from the region declined, from approximately 56% in 2000 to 35% in 2018.
Latin American economic analysts have nearly reached a consensus that the Alianza del Pacífico, with its sound macroeconomic and private investment policies, is positioned to lead future economic growth in Latin America (Alianza del Pacífico, 2018). This group also may include Ecuador, which has applied for membership. Bolivia, although applying alternative sets of policies, also continues to grow, thanks largely to the increase in nonagricultural natural resources exports (e.g., natural gas, tin, and silver). Overall, the Andean region appears poised to expand its population, per capita income, and middle class, which will create a strong demand for imports of food and commodities the region may not produce competitively or sufficiently, primarily cereals, meats, oilseeds, and dairy.
Most of the region’s countries could improve their current trade by facilitating their logistics infrastructures, which, with the exception of Chile, lag behind the other large Latin American countries. A recent World Bank study reported logistic costs as a percentage of food product value as high as 32%, 23% and 18% in Peru, Colombia, and Chile, respectively, compared to the OECD average of 13% (Chaherli and Nash, 2013). Fortunately, Colombia, Peru, Ecuador, and even Bolivia have embarked on large projects to modernize and expand their export logistics (Chaherli and Nash, 2013).
All of this may represent an excellent opportunity for the United States to expand agricultural exports to the region. However, two factors must be considered. First, Brazil and Argentina—which also produce the main commodities the U.S. exports to the region—seem to be improving and modernizing their agricultural sectors and may become serious competitive exporters to the Andean region, particularly its southern part (Duff and Padilla, 2015). Second, Chile and Peru (and eventually Colombia) are members of the newly created CPTPP trade area, which will begin implementation in 2019. This free trade area includes Australia, New Zealand, and Canada, strong competitors with the United States in cereals, meats, and dairy products. Third, there is some potential for increased trade among the Andean countries, as they have all experienced economic growth and some specialize in producing certain agricultural products currently exported from the United States.
The United States may be facing a growing surge in fruit and vegetable imports and other products from the Andean region, almost certainly from Chile and Peru, but also likely from Colombia and Ecuador. The region is experiencing rapid growth due to its use of modern agricultural technologies and business practices and the expansion of agricultural land under irrigation. Peruvian coastal irrigation projects are behind schedule but will eventually (in the next five years) incorporate nearly 300,000 hectares of high-quality land dedicated almost entirely to export-oriented produce (Redagricola, 2017). The region has the potential for even further expansion of agricultural land. According to Fischer and Shah (2010), Bolivia, Peru, Colombia, and Ecuador have approximately 109 million hectares of potentially available good land for the production of wheat, maize, soybeans, sugarcane, or palm oil, approximately 10% of which is highly accessible. U.S. consumers will surely benefit from a larger variety of fruits and vegetables with lower prices if the Andean countries can compete efficiently with the lower transportation cost of Mexican exports. Moreover, those imports come when the Northern Hemisphere is in its season of lower production. The region also is innovating by introducing “superfoods” to the rest of the world, including quinoa, açai berries, lucuma, and amaranth, but these crops still account only for a very small share of exports (Krader and Bartenstein, 2018).
Finally, although not the main focus of this article, countries in the Andean region also need to face the challenge of high poverty levels among smallholder farmers who have not benefited from growth in the agricultural sector and its focus on export-oriented policies and markets.
Alianza del Pacífico. 2018. Alianza del Pacífico: Visión 2030. Available online: https://alianzapacifico.net/download/alianza-del-pacifico-vision-2030-version-final-julio-24/.
Chaherli, N., and J. Nash. 2013. Agricultural Exports from Latin America and the Caribbean: Harnessing Trade to Feed the World and Promote Development. World Bank, Washington, DC. Available online: https://openknowledge.worldbank.org/handle/10986/16048.
Comunidad Andina (CAN). 2019. Quiénes Somos? Available online: http://www.comunidadandina.org/Seccion.aspx?id=189&tipo=QU&title=somos-comunidad-andina.
Duff, A., and A. Padilla. 2015, September 28. “Latin America: Agricultural Perspectives.” Rabobank. Available online: https://economics.rabobank.com/publications/2015/september/latin-america-agricultural-perspectives/.
Egas, J.J., and C.P. De Salvo. 2018. Agricultural Support Policies in Latin America and the Caribbean: 2018 Review. Agricultural Policies Reports: 44.
Fischer, G., and M. Shah. 2010. Farmland Investments and Food Security. Report prepared under World Bank IIASA constract -Lessons for the large-scale acquisition of land from a global analysis of agricultural land use. Available online: http://wedocs.unep.org/bitstream/handle/20.500.11822/18548/644450WP00publ00Security0BOX361537B.pdf?sequence=1&isAllowed=y
Food and Agriculture Organization of the United Nations (FAO). 2014. The State of Food and Agriculture. Rome, Italy: Food and Agriculture Organization of the United Nations. Available online: http://www.fao.org/3/a-i4040e.pdf.
Food and Agriculture Organization of the United Nations (FAO). 2015. Amazon Basin. Available online: http://www.fao.org/nr/water/aquastat/basins/amazon/index.stm.
Food and Agriculture Organization of the United Nations (FAO). 2019. FAOSTAT Crops Data. Available online: http://www.fao.org/faostat/en/#data/QC.
Gao, G. 2015. “Latin America’s Middle Class Grows, but in Some Regions more than Others.” Pew Research Center. Available online: https://www.pewresearch.org/fact-tank/2015/07/20/latin-americas-middle-class-grows-but-in-some-regions-more-than-others/
Gestion, R. 2019, March 1. Agroexportaciones Sumaron US$ 7,030 Millones en 2018, ¿Qué Productos Tuvieron Más Ventas? Available online: https://gestion.pe/economia/agroexportaciones-sumaron-us-7-030-millones-2018-productos-tuvieron-ventas-254606.
Knapp, G. 2015. “Mapping Flower Plantations in the Equatorial High Andes.” Journal of Latin American Geography 14(3): 229–244.
Krader, K., and B. Bartenstein. 2018, July 10. “Home to Quinoa and Açai Berries, Peru has a New Superfood.” Bloomberg. Available online: https://www.bloombergquint.com/businessweek/lucuma-peru-s-latest-superfood-export.
Lambert, J. 2019, August 19. “Alarm as Devastating Banana Fungus Reaches the Americas.” Nature. Available online: https://www.nature.com/articles/d41586-019-02489-5.
National Geographic. 2019. South America: Resources. Available online: https://www.nationalgeographic.org/encyclopedia/south-america-resources/.
Observatory of Economic Complexity (OEC). 2019. Bananas. Available online: https://oec.world/en/profile/hs92/0803/.
Paz Ballivián, D. 2003. “Medio Siglo de la Reforma Agraria Boliviana.” Temas Sociales: 183–188. Available online: http://www.revistasbolivianas.org.bo/pdf/rts/n25/n25a11.pdf
Redagricola. 2017. Se Incorporaran 300,000 Ha Más de Riego a 2021. Available online: http://www.redagricola.com/cl/grandes-obras-hidraulicas-peru-se-incorporaran-300-000-ha-mas-al-riego-2021/.
Tridge. 2019. Top Exports Destinations from Bolivia. Available online: https://www.tridge.com/intelligences/soybean/BO.
UN Comtrade. 2019. UN Comtrade Database. Available online: https://comtrade.un.org/data/.
World Bank. 2019. World Development Indicators. Available online: https://databank.worldbank.org/source/world-development-indicators.
U.S. Department of Agriculture (USDA). 2019. USDA FAS GATS Global Trade System. Washington, DC: U.S. Department of Agriculture, Foreign Agricultural Service. Available online: https://apps.fas.usda.gov/gats/default.aspx.

