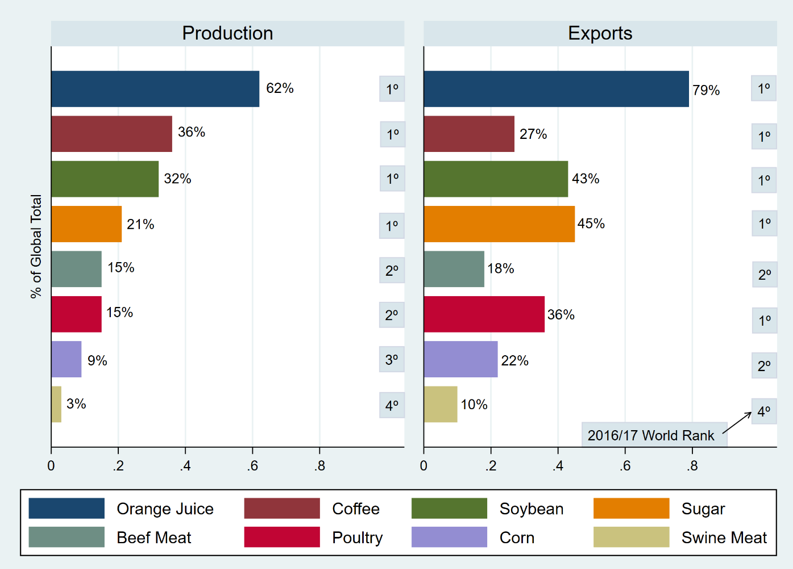
Source: USDA (2018).
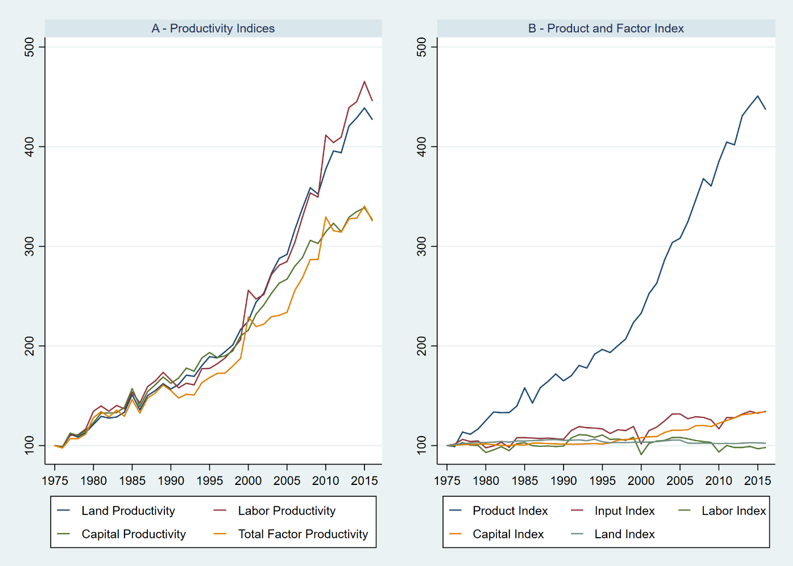
Source: Gasques, Bachi, and Bastos (2018).

Source: CONAB (2019).
We explore Brazilian potential as a global food supplier. Brazil’s performance in the production and export of agricultural commodities has been excellent, as shown in Figure 1; its market share of both global production and exports indicates that the country is a major player among the world’s food suppliers.
Technological advances, combined with the expansion of the agricultural frontier, have driven Brazil’s growth. But will Brazil continue to expand agricultural production to meet ever-increasing global demand for food? To shed light on Brazil’s potential as a food supplier, we discuss some of the main drivers of the country’s success, including productivity gains, land and water availability, research and technology, and domestic policies.
Productivity has been the primary driving force in the growth of Brazil’s agricultural sector. According to Gasques, Bachi, and Bastos (2018), higher productivity was responsible for 80.6% of agricultural production growth from 1975 to 2016. To reach this conclusion, the authors estimated Brazil’s total factor productivity (TFP), the ratio of aggregate agricultural outputs and inputs (land, labor, and capital) used in agricultural production. From 1975 to 2016, the TFP increased, on average, by 3.08% per year. In the same period, land and labor stood out, with annual growth rates of 3.84% and 3.74%, respectively (Figure 2A).
Efficiency in input use allowed Brazil to more than quadruple its agricultural production in the last 40 years (Figure 2B, blue line). Brazil’s agricultural production grew at rates (3.82% per year) much higher than the growth (0.72% per year) in the use of inputs such as land, labor, and capital (Figure 2B, red line).
Since the 1990s, capital inputs such as fertilizers, pesticides, and agricultural machinery have been the main drivers of agricultural growth. Figure 2 shows a growing trend in the capital productivity factor over the last 20 years (Figure 2B, orange line). For example, the use of fertilizers increased from 6.5 million tons in 2000 to 15 million tons in 2016 (Gasques, Bachi, and Bastos, 2018). At the same time, land and labor have trended downward (Figure 2B). For instance, by the 2000s, the sector employed about 16 million people. Today, that number has fallen to 13 million people working on farms (Gasques, Bachi, and Bastos, 2018), which explains the negative labor index values.
Brazilian agriculture has benefited from the development and adoption of technologies resulting from domestic research and innovations based on the peculiarities of the country. For example, universities and the Brazilian Agricultural Research Corporation (Embrapa) developed new technologies that made the agricultural production viable in the Cerrado region. These technologies also generated gains in economies of scale. Producers in southern Brazil, where farms were small and land prices high, moved to the Midwest (Cerrado region), where farms were large and land was affordable.
The effectiveness of Brazilian technological development is also expressed in crop productivity gains. Crop yield performance in Brazil has increased over the past 40 years. Figure 3 illustrates steady growth in cotton, corn, rice, and soybean yields. The production technology used in the Cerrado region allows for two crops per growing season. Since the 1980s, the country has produced soybeans in the winter and corn in the fall (called second-season corn). Figure 3 shows that the first- and second-season corn reached the same level of productivity this decade. Second-season corn demonstrates Brazil’s ability to generate technology to produce under adverse conditions. Also, second-season cornallows Brazil to increase its production of corn-fed meat and its export potential. However, Brazil still has room to improve both its corn and meat productivity. For example, in 2017, the United States averaged 176.7 bushels/acre of corn, while Brazil averaged 81.1 bushels/acre (Adcock et al. 2018). At the same time, the United States, with 92.7 million head of cattle, produced 12.1 tons of carcass weight equivalent (CWE), while Brazil, with more than double the number of head (223.2 million), produced only 9 million tons of CWE (USDA, 2018).[1]
A small part of the productivity growth in Brazil is uniform across farmers in the industry. According to Filho (2019), about 20% of producers benefited from the tropicalization of grain production, signaling that economic churning (new entrants and efficient farms buying/renting inefficient farms) will still occur, leading to a substantial increase in productivity.
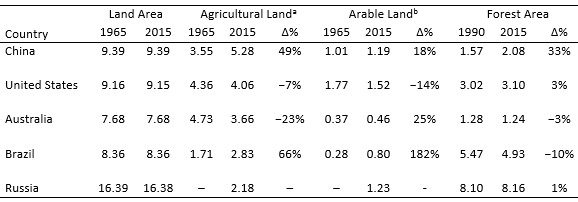
Note: Contiguous U.S. land is 7.65 106 km2.
aThe World Bank defines agricultural land as the share of land area that is arable, under
permanent crops, or under permanent pastures.
bThe World Bank defines arable land as land under temporary crops (double-cropped areas
are counted once), temporary meadows for mowing or for pasture, land under market or
kitchen gardens, or land temporarily fallow.
Source: World Bank (2018).
Among the top five countries with the largest agricultural areas, Brazil had the most significant agricultural land expansion (66%) over the last five decades, while the United States reduced its agricultural land by 7% (Table 1). However, Brazil’s agricultural land is still smaller than Australia (−23%), the United States (−30%), and China (−46%). Arable land shows similar behavior. Even with agricultural expansion, almost 60% of the country remains forested.
Source: Embrapa (2019a).
Note: Embrapa/IBGE classifies agricultural potentiality according to
soil characteristics (physical, morphological, and topographical).
Source: Soma Brasil (2019).
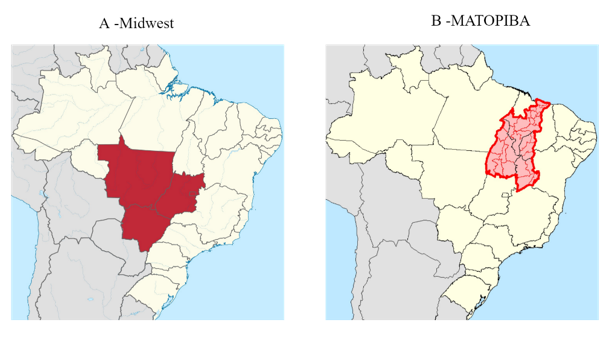
Note: Midwest includes Goiás (GO), Mato Grosso (MT), and
Mato Grosso do Sul (MS) states. MATOPIBA includes Maranhão
(MA), Tocantins (TO), Piauí (PI), and Bahia (BA) states.
Source: Mattos (2019).
Note: Goiás (GO), Mato Grosso (MT), Mato Grosso do Sul (MS),
Pará (PA), Maranhão (MA), Tocantins (TO), Piauí (PI), and Bahia (BA).
Source: CONAB (2019).
Source: Soma Brasil (2019).
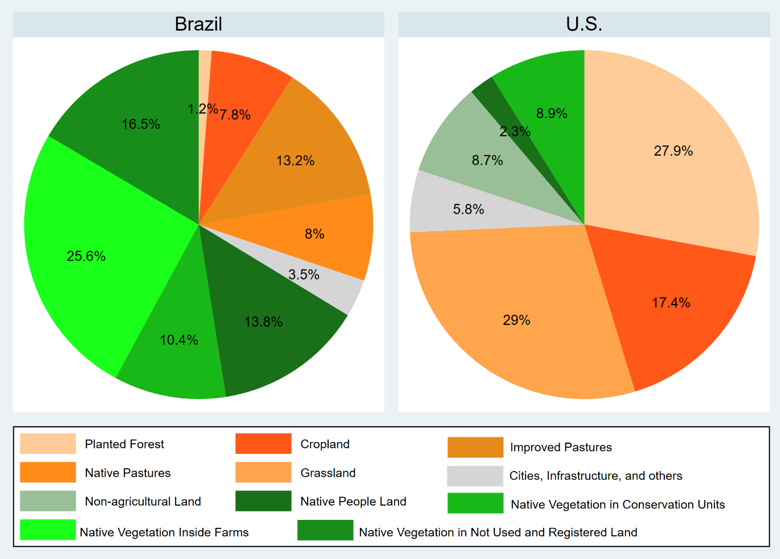
Source: Embrapa (2019).
Brazil uses a small portion of its land for agriculture. Embrapa (2019) contrasts the land use in Brazil and the United States, as shown in Figure 4. Brazil allocates 21% of its land for farming (7.8% for crops and 13.2% for livestock). The United States uses 17.4% of its land for grain production. The corresponding number of hectares (ha) is greater than the combined area under crops and improved pastureland in Brazil. The amount of native vegetation inside Brazilian farms (25.6%) and native pasture (8%) is striking. Although Brazil plows less than 10% of its area, according to OECD (2018), 28% of its land is arable.
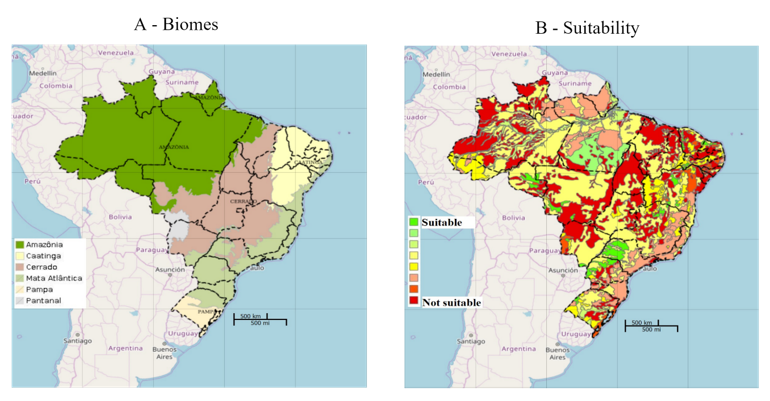
Figure 4 reflects Brazil’s strict environmental laws. The Forest Code (Law N. 12,651 of 2012) states that in the Amazon biome (Figure 5A), 80% of the private property must be kept under natural vegetation (legal reserve); in the Cerrado biome (Figure 5A), 35% of private property must remain under natural vegetation. To help law enforcement, the government established the Rural Environmental Registry (CAR) in 2012.[2] CAR collects georeferenced information of each rural property with detailed environmental data to combat deforestation and assist with economic planning.
In addition to the government’s efforts to prevent deforestation, the private sector and non-governmental organizations (NGOs) signed an agreement (soybean[3] and meat[4] moratorium) to not trade or finance commodities from deforested areas of the Amazon region (Figure 5A). Access to large markets, such as the European market, stimulates the industry to follow strict environmental requirements. Hence, the Forest Code and the CAR can facilitate Brazil’s access to new markets.
Since Brazil is not expected to add a substantial amount of new land to production because of the Forest Code, Brazil’s potential as a food supplier relies on strategic land use and technological development. Embrapa created a unit—Embrapa Territorial—dedicated exclusively to strategic land use. Embrapa Territorial monitors agricultural activity and deforestation on farms using satellite images. Another governmental strategic tool is the Agricultural Zoning Program (ZARC), which indicates the best crop for a given region as well as the technical procedures to increase productivity, reduce risks, and protect the environment. ZARC supports some major agricultural policies, such as insurance and rural credit. Farmers who wish to access such programs must follow ZARC prescriptions, which helps increase farm efficiency.
Although the Cerrado biome (Figure 5A) is regarded as unfit for grain production (Figure 5B), Brazil developed the technology to grow grains in acid and nutrient-poor soils. Also, Brazil can harvest two crops per year (discussed in the previous section) under these conditions in the Midwest. In the 1980s, Brazil expanded production to the Midwest (Figure 5A). Today, production is expanding toward the northeast Cerrado and some northern regions (Adcock et al., 2018).
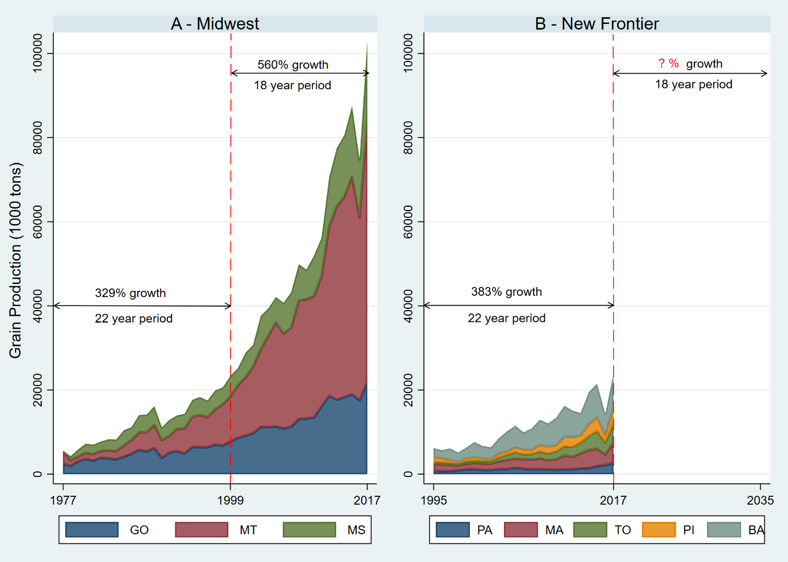
Midwest expansion caused a substantial increase in Brazil’s grain production (Figure 7A). The new frontier, a region known as MATOPIBA, in the northeast Cerrado has 73 million hectares to strengthen agricultural production (Embrapa, 2019). Given the agricultural potential of the MATOPIBA, the national congress created an agency (Agência MATOPIBA) in 2017 just for the development of the region. Figure 6 highlights the Midwest and the MATOPIBA region.
The northern states of Pará (PA) and Rondônia (RR) are also regarded as agricultural frontier, especially the green highlighted area in the north of Figure 5B. Because this area is in the Amazon biome (Figure 5A), there are many restrictions on economic activities (for example, the Forest Code). However, the region has 20.6 million hectares of grassland and 2.21 million hectares of crops (IBGE, 2017).
The MATOPIBA region is not well-suited for agriculture (Figure 5B), but neither was the Midwest at one time. If Brazil shows similar ability to adapt crops to new environments and increase productivity in MATOPIBA, as it did in the Midwest, the country will be able to increase its food production (Figure 7) significantly in years to come. The competitive advantage of the MATOPIBA region over the Midwest is its proximity to foreign markets.
Adcock et al. (2017) discuss how infrastructure bottlenecks affect agricultural exports in Brazil. Grain flows from the Midwest states (Figure 6A) to the southern ports mostly on poorly maintained highways for over 1,000 miles. However, the North–South railroad (operated in a private–public partnership) crosses the MATOPIBA region toward the northern port of Itaqui (Maranhão).[5] This logistical advantage can boost the region’s agribusiness.
The Brazilian Ministry of Agriculture (Ministério da Agricultura, Pecuária e Abastecimento, MAPA, 2019) forecasts growth of 9.5 million ha (+ 15.3%) and 63.4 million tons (+26.8%) of grain over the next ten years (2028/29).[6] MAPA also foresees poultry, beef, and pork production increasing by 3.88 (+28.6%), 2.07 (+24.6%), and 1.12 (+28.2%) million tons over the next ten years (2028/2029), respectively. During this period, MAPA expects the major grain expansion to occur in the Midwest (+ 35.7 million tons and + 7.7 million ha) and MATOPIBA (+6.5 million tons and + 1.1 million ha). MAPA projections were made using times series models (auto regressive integrated moving average [ARIMA]), so the forecasts do not include the structural and technological changes underway in the country.
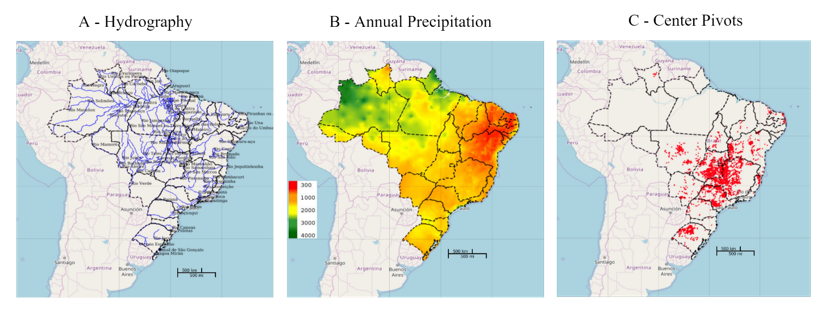
Since Brazilian water resources are abundant and widespread (Figure 8), incorporating irrigation into production systems can increase production. The nation has 8,647 billion m3/year of total renewable surface water(FAO, 2014). Piauí, one of Brazil’s driest states, receives a third more water than the U.S. Corn Belt (The Economist, 2010). According to the Brazilian National Water Agency (2017), Brazil has the potential to expand to over 76 million ha of irrigated crop area, in addition to the 6.95 million ha currently under irrigation (Figure 8C).
Most of Brazil’s agricultural expansion will likely come from approximately 145 million hectares of underutilized or degraded pastureland (Cunha, Ribeiro, and Guarenghi, 2019). Annual crops have been taking over the pasture area in Brazil for the last 40 years. From 1975 to 2016, annual crops expanded from 36.8 million ha to 69.5 million ha while pasture was reduced from 165 million ha to 145 million ha (Gasques, Bachi, and Bastos, 2018). Brazil has been developing and adopting new pasture recovery technologies, as we discuss in the next section.
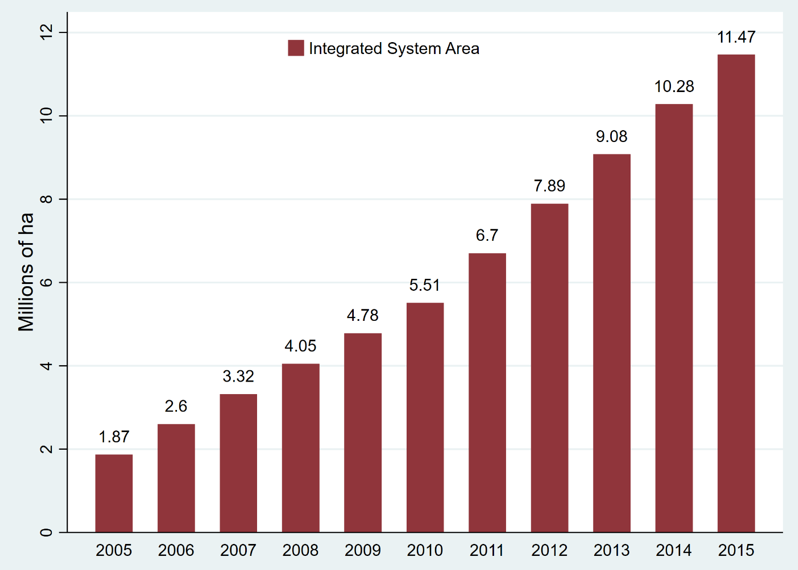
In 1992, the government created the National Agricultural Research System (Sistema Nacional de Pesquisa Agropecuária, SNPA): Strategically associated research centers—such as Embrapa, state research organizations, research institutes, universities and private organizations—address various, regionally specific research topics . According to Embrapa (2019),[7] the research agenda of public and private organizations will prioritize and encourage more resilient and sustainable production systems. Some examples of their research priorities are: crop-livestock-forest integration, agroforestry, organic agriculture, no-till production, biological nitrogen fixation, recovery of degraded pastures, management of native forests and planted forests, irrigation optimization, biological control of pests and diseases, and waste recycling and protected production. Integrated systems are a promising solution not only to increase production but also to recover degraded and degrading land. The most common integration system in Brazil involves soybeans, corn, grass, and cattle. After soybeans are harvested, farmers plant corn mixed with grass (brachiaria). When the corn is harvested, the grass is ready for grazing. The cattle are fattened in the pasture. After the cattle are removed for slaughter, the area is dried out, and soybeans are planted on the straw using no-till practices. The system occurs within one crop year without irrigation. Another possible configuration is to introduce tree planting (for example, eucalyptus) into the system.
Given that Brazil has developed the technology to produce three commodities rather than just one over a single year on the same amount of land, the prospects for increased production are bright. Moreover, the integrated system is economically feasible, as over 11 million ha, an area roughly the size of Germany’s total agricultural land, are already under this production system (Figure 9).
From 2000 to 2017, Embrapa’s budget increased from R$ 2.1 billion ($0.63 billion) to R$3.4 billion ($1.02 billion) (Santana and Gasques, 2019).[8] Within this budget in 2013, Embrapa launched a new intelligence center, Agropensa,[9] which evaluates the major factors that will shape demand for food such as population growth in developing countries, longevity, purchasing power, urbanization, and new consumption patterns to strategically identify future research areas or to provide resources for current research.
According to Agropensa, seven trends provide insight into the future of Brazilian agriculture: (i) socioeconomics and spatial changes in agriculture; (ii) intensification and sustainability of agricultural production systems; (iii) climate change; (iv) agricultural risks; (v) added value in agricultural supply chains; (vi) consumer roles; and (vii) technological and knowledge convergence in agriculture. Guided by these topics,SNPA will develop new production processes, methods, and systems to address growing demands for water, food, and fiber worldwide.
Source: MAPA (2018a).
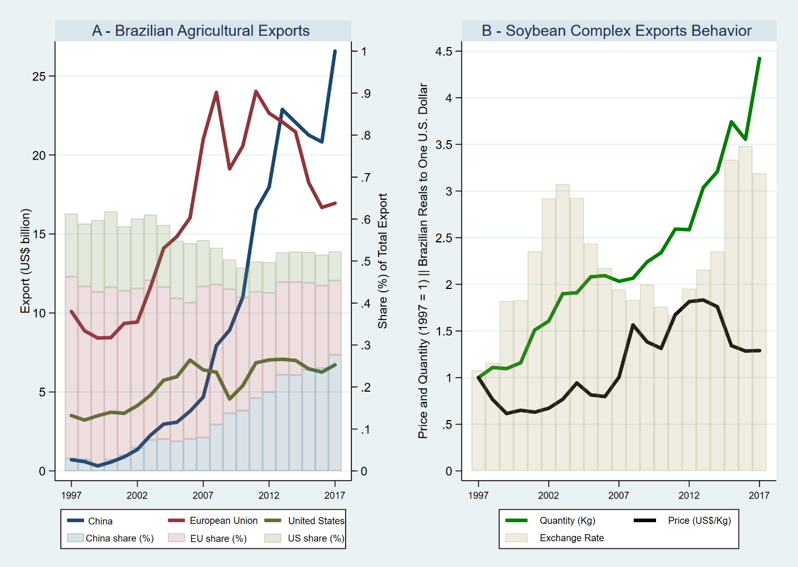
In the 1990s, the European Union (EU) purchased almost half of all Brazilian agricultural exports. However, in the last decade, Brazil has reduced its exports to the continent by more than 30% (Figure 10A). The free trade agreement between Mercosur[10] and the EU signed last June may lead Brazil to reverse the downward trend in agricultural exports to the EU. Today, China is the leading export market for Brazil, having acquired about 30% (~US$26 billion in 2017) of agricultural exports in recent years (Figure 10A), experiencing a 37-fold increase from 1997 to 2017. The U.S.–China trade war may further strengthen the growth of Brazilian agricultural exports to China. Additionally, Brazil and the United States began negotiations for a free trade agreement in August 2019. It is premature to predict the effects of Brazil–U.S. negotiations.
Aside from the vital role of Chinese imports to Brazilian agribusiness growth, the exchange rate also favored Brazil’s competitiveness in foreign markets. For example, Figure 10B shows the steady growth in soybean exports, even in the face of price reductions (in dollars) since 2011, given the advantageous exchange rate. The soybean complex was responsible for 40.23% of Brazilian agricultural exports in 2018, followed by meat (14.51%), forest products (13.80%), sugar and alcohol complex (7.35%), and coffee (4.90 %) (MAPA, 2018a).
Although Brazil’s exports are concentrated in a few products, Brazilian agriculture has recently incorporated value-added products such as cotton, fruits, and vegetables (Homma, Lima and Vieira., 2019). The new productive arrangements (required by these cultures) embody Brazil’s potential as a food provider. The MATOPIBA region has both cotton (i.e., Barreiras) and fruit (i.e., Vale do São Francisco) production clusters.

Notes: Producer Support Estimate (PSE) refers to the annual monetary
value of gross transfers from consumers and taxpayers to agricultural
producers, measured at the farm-gate level, arising from policy measures
that support agriculture regardless of their nature, objectives or impacts
on farm production or income. PSE is the sum of two elements: market
price interventions and direct payments to producers. PSE %: PSE as
a share of gross farm receipts (including support). PSE = 20%. Without
PSE, producers would be receiving 20% less than they receive now.
Source: OECD (2018).
In recent years, Brazil has performed well in agricultural production and exports with little government support (Figure 11). The majority of Brazilian support is based on variable inputs, mainly concessional credit (farm marketing and working capital). Since 2008, such credit has depended on producers’ compliance with environmental criteria (Forest Code). Santana and Gasques (2019) reported that Brazilian agricultural policy has been reducing market intervention and standing out more as a normative agent and market regulator. The authors foresee greater private-sector participation in public policies such as rural credit, storage, and public–private partnerships.
Public–private partnerships are crucial to solving some logistical barriers. For example, the Northern Arc Ports (Porto Velho, Itacoatiara, Miritituba, Santarém, Barcarena, São Luís) and the Ferrogrão railroad projects are sponsored and funded by some major grain companies such as Amaggi, ADM, Bunge, Cargill, and Dreyfuss. Ferrogrão will take production from the Midwest to the northern waterways and then to the Northern Arc Ports for export, creating more distribution channels and lower transportation costs to help Brazil meet global food demand.
Moreover, the new Brazilian biofuels policy, RenovaBio, establishes the strategic role of biofuels in both the energy matrix and in reducing greenhouse gases. For the Ministry of Mines and Energy (Ministério de Minas e Energia, MME, 2018), this policy will increase ethanol production from 30 billion liters in 2017 to 50 billion liters in 2030. Sugarcane-planted area is expected to expand by 3 million hectares, from 10.2 to 13.2 million ha by 2030. Concurrently, biodiesel production will expand from 4 billion liters in 2017 to 13 billion liters in 2030. Then, only for biodiesel production, soybean planted area is expected to expand 7 million hectares by 2030. Another implication of this policy is the proliferation of corn ethanol plants. There are five currently corn-based ethanol mills, with six more under construction (UNEM, 2019). Corn consumption by mills is expected to reach 17 million tons by 2030, an increase of 12 million tons. (UNEM, 2019).
Brazil has abundant resources, including land, water, and technology to ensure production growth. New agricultural frontiers, new technologies, limited political intervention, private-sector investment in transportation infrastructure, and a diversified agriculture in both productive arrangements and traded varieties (biofuels, cotton, fruits, and vegetables) are all factors that boost the country’s ability to continue as one of the leading producers of agricultural commodities worldwide.
Adcock, F.J., Y.C.D. Calil, L. Ribera, and P. Rosson. 2017. The Brazilian Market for U.S. Agricultural Food Products. CNAS Report 2017-3. College Station, TX: Texas A&M, Center for North American Studies.
Adcock, F.J., L. Ribera, Y.C.D. Calil, and C. Valde. 2018. Brazil at 2040: Customer and Competitor. CNAS Report 2018-2. College Station, TX: Texas A&M, Center for North American Studies.
Brazilian National Water Agency. 2017, Atlas da Irrigação. Available online: http://atlasirrigacao.ana.gov.br/
Companhia Nacional de Abastecimento (CONAB). 2019. Portal de Informações Agropecuárias. Available online: https://portaldeinformacoes.conab.gov.br/
Cunha, M.P., C.H. Ribeiro, and M.M. Guarenghi. 2019. “Bioenergy and Biofuels in Brazil.” In A.M. Buainain, R. Lanna, and Z. Navarro, eds. Agricultural Development in Brazil: The Rise of a Global Agro-Food Power. Abingdon, England: Routedge, pp. 123–138.
Dias-Filho, M.B.. 2014. Diagnóstico de Pastagens no Brasil. Documentos 402. Belém,Brasil: Embrapa Amazônia Oriental. Available online: https://ainfo.cnptia.embrapa.br/digital/bitstream/item/102203/1/DOC-402.pdf
Empresa Brasileira de Pesquisa Agropecuária (Embrapa). 2019. Integração Lavoura-Pecuária-Floresta. Available online: https://www.embrapa.br/tema-integracao-lavoura-pecuaria-floresta-ilpf
Empresa Brasileira de Pesquisa Agropecuária (Embrapa). 2019a. Agricultura E Preservação Ambiental: Uma Análise do Cadastro Ambiental Rural. Available online: https://www.embrapa.br/car/sintese
Empresa Brasileira de Pesquisa Agropecuária (Embrapa). 2019b. Matopiba. Available online: https://www.embrapa.br/tema-matopiba/sobre-o-tema
Food and Agriculture Organization of the United Nations (FAO). 2014. AQUASAT – FAO’s Global Information System on Water and Agriculture. Available online: https://www.fas.usda.gov/data
Filho, V.R.E.J. 2019. “Innovation and Development of Brazilian Agriculture – Research, Technology and Institution.” In A.M. Buainain, R. Lanna, and Z. Navarro, eds. Agricultural Development in Brazil: The Rise of a Global Agro-Food Power. Abingdon, England: Routedge, pp. 108–122.
Gasques, J.G., M.R.R.P. Bachi, and E.T. Bastos. 2018. Crescimento e Produtividade da Agricultura Brasileira de 1975 a 2016. Available online: http://www.ipea.gov.br/
Homa, A. K. O. Lima, J. R. F., Vieira, P.A.. 2019. “Structural Heterogeneity in rural Brazil .” In A.M. Buainain, R. Lanna, and Z. Navarro, eds. Agricultural Development in Brazil: The Rise of a Global Agro-Food Power. Abingdon, England: Routedge, pp. 189–207.
Instituto Brasileiro de Geografia e Estatística (IBGE). 2017. Censo Agropecuário 2017. Available online: https://censos.ibge.gov.br/agro/2017/
Mattos, F. 2019. “Will ‘Matopiba’ Change the Competitive Landscape in the International Grain Market?” Cornhusker Economics. Available online: https://agecon.unl.edu/cornhusker-economics/2019/matopiba-international-grain-markets
Ministério da Agricultura, Pecuária e Abastecimento (MAPA). 2018a. AGROSTAT – Estatísticas de Comércio Exterior do Agronegócio Brasileiro. Available online: http://indicadores.agricultura.gov.br/
Ministério da Agricultura, Pecuária e Abastecimento (MAPA). 2018b. Plano Agrícola e Pecuário 2018/2019. Available online: http://www.agricultura.gov.br/assuntos/politica-agricola/plano-agricola-e-pecuario/arquivos-pap/folder-pap-2018-2019
Ministério da Agricultura, Pecuária e Abastecimento (MAPA). 2019. “Em Dez Anos, Área Plantada Será Ampliada em 10,3 Milhões de Hectares no Brasil [Press Release].” Available online: http://www.agricultura.gov.br/noticias/em-dez-anos-area-plantada-no-brasil-sera-ampliada-em-10-3-milhoes-de-hectares
Ministério de Minas e Energia (MME). 2018. RenovaBio. Available online: http://www.mme.gov.br/web/guest/secretarias/petroleo-gas-natural-e-combustiveis-renovaveis/programas/renovabio/principal
Nova Cana. 2019. Usinas do Brasil. Available online: https://www.novacana.com/usinas_brasil
Organisation for Economic Co-Operation and Development (OECD). 2018. Producer and Consumer Support Estimates Database. Available online: https://www.oecd.org/unitedstates/producerandconsumersupportestimatesdatabase.htm
Santana, C.A.M, and J. Gasques. 2019. “Agricultural Development in Brazil: The Role of Agricultural Polices.” In A.M. Buainain, R. Lanna, and Z. Navarro, eds. Agricultural Development in Brazil: The Rise of a Global Agro-Food Power. Abingdon, England: Routedge, pp. 46–69.
Soma Brasil. 2019. Brazilian Agriculture Observation and Monitoring System. Available online: http://mapas.cnpm.embrapa.br/somabrasil/webgis.html
The Economist. 2010. The Miracle of the Cerrado. Available online: https://www.economist.com/briefing/2010/08/26/the-miracle-of-the-cerrado
União Nacional do Etanol de Milho (UNEM). 2019. Demanda de Milho para Etanol Deve Atingir 17 Milhões de Toneladas em 10 Anos. Available online: http://etanoldemilho.com.br
United States Department of Agriculture. 2018. Foreign Agricultural Service Data & Analysis. Available online: https://www.fas.usda.gov/data
World Trade Organization (WTO). 2017. International Trade and Market Access Data. Available online: https://www.wto.org
World Bank. 2018. Data. Available online: https://data.worldbank.org/
[1] Unlike in the United States, the majority of cattle are fattened in pasture and the use of hormones is forbidden.
[2] As of June 2019, CAR has 5.9 million registered properties. See http://www.car.gov.br/publico/imoveis/index.
[3] According to ABIOVE (http://abiove.org.br/en/sustainability/), “The Soy Moratorium is a trade agreement, signed in July 2006, between the Brazilian Association of Vegetable Oil Industries (ABIOVE), the National Grain Exporters Association (ANEC), the government and civil society. This agreement is a commitment not to trade, nor finance, soy produced in areas in the Amazon Biome deforested after 22 July 2008, the reference date of the Forest Code.”
[4] Like the soybean industry, the meat industry has also signed an agreement not to market meat from regions of illegal deforestation (https://amazoniareal.com.br/empresas-fazem-acordos-da-moratoria-da-carne/)
[5] The North–South railroad private public partnership was signed on July 31, 2019. For more information: http://agenciabrasil.ebc.com.br/politica/noticia/2019-07/contrato-de-concessao-da-ferrovia-norte-sul-e-assinado-em-anapolis
[6] Detailed forecast for each commodity can be found at http://www.agricultura.gov.br/assuntos/politica-agricola/todas-publicacoes-de-politica-agricola/projecoes-do-agronegocio/projecoes-do-agronegocio-2018-2019-2028-2029
[7] For more details of Embrapa’s study on the future of Brazilian agriculture: https://www.embrapa.br/en/visao/o-papel-da-ciencia-tecnologia-e-inovacao.
[8] Values expressed in reales (Brazilian currency) of 2017. 2017 yearly average of exchange rate: $1 = R$ 3.332.
[9] More details on Agropensa: https://www.embrapa.br/en/agropensa and https://www.embrapa.br/en/busca-de-noticias/-/noticia/25240884/agropensa-vence-premio-internacional-por-inovacao-institucional
[10] Southern Common Market (Mercosur) member countries are Argentina, Brazil, Paraguay, and Uruguay. The EU–Mercosur free trade agreement has been signed but not yet ratified by the congresses of the agreement’s countries.

