Mexico is a major global producer and exporter of agricultural products, capturing a significant share of the total world exports of citrus and melons (31%), tomatoes (24%), cucumbers (19%), and tropical fruit (22%), including pineapples, mangoes, avocados, and guavas (ITC, 2019). The agriculture and food sector is one of the main engines of Mexico’s rural economy, representing 3.3% of its national gross domestic product (GDP) (World Bank, 2019). The sector has experienced significant growth during the last few years: Production value of crops and livestock increased by 21% and 12%, respectively, between 2012 and 2017 (SIAP, 2018b). Mexico’s exports and share in total world exports of agricultural products also increased during the same period.
International trade has become more important for the Mexican economy in the last 30 years. Mexico currently has 12 free trade agreements with 46 countries (Secretaría de Economía, 2015). The North American Free Trade Agreement (NAFTA), which has facilitated trade among the United States, Mexico, and Canada since 1994, has become the most important trade platform for Mexico. In September 2018, the three countries reached an agreement to replace NAFTA with the United States–Mexico–Canada Agreement (USMCA), but NAFTA remains in force pending full ratification of the USMCA. In 2018, Mexico also signed the Comprehensive and Progressive Agreement for Trans-Pacific Partnership (CPTPP) and ratified a modernized Global Agreement with the European Union (EU) (Secretaría de Economía, 2018), which will likely increase diversification into European markets. Other major markets with potential for Mexico include China, which has 1.3 billion consumers and a rapidly growing middle class, and Central America, with which it shares consumption habits and tastes.
Data Source: U.S. Department of Agriculture (2019c).
Note: Total World Trade Organization (WTO) agricultural
imports and exports.
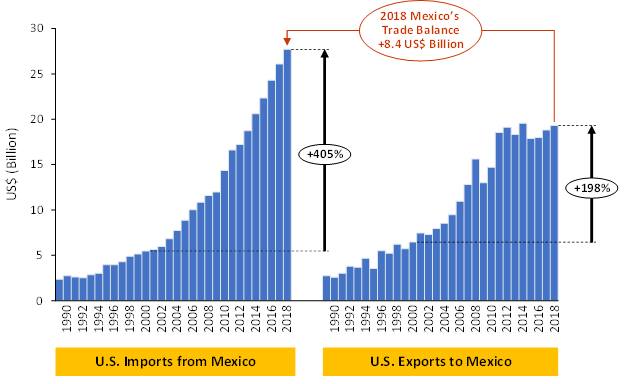
Data Source: UN Comtrade Database (2018). U.S. and Mexico
bilateral trade.
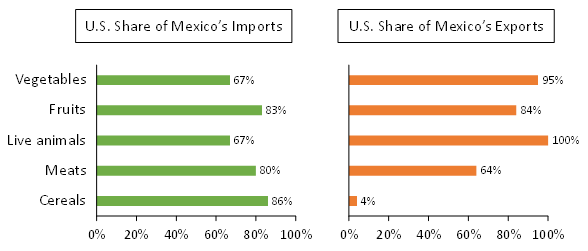
Note: Authors’ own calculations from total export and import value
data in 2018: vegetables (HS 07), fruit (HS 08), live animals
(HS 01), meat (HS 02), and cereals (HS 10).
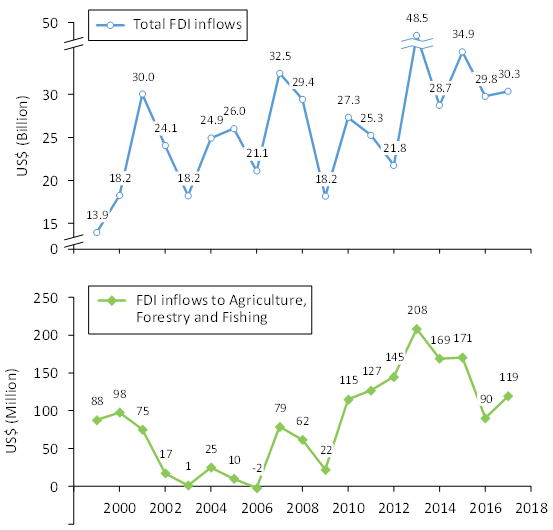
Data Source: CNIE (2018).
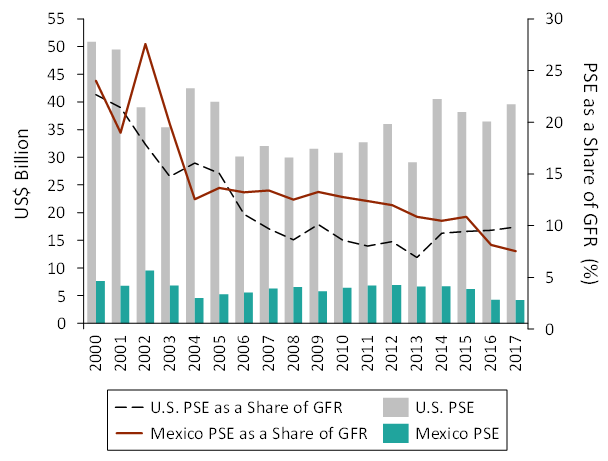
Data Source: OECD (2018).
Mexico’s favorable climate allows for year-round fruit and vegetable production, which are exported primarily to the United States. Between 2000 and 2018, Mexico’s exports of agricultural products to the United States increased by 405%, twice as fast as Mexico’s imports from the United States (Figure 1). Mexico’s trade balance with the United States reached a record high of US$8 billion in 2018 (Figure 1). Exports of fruit and vegetables have been important drivers of this trade surplus.
The United States buys nearly 78% of Mexico’s total agricultural exports, most of which are predominantly labor-intensive crops. Similarly, the United States supplies more than 80% of Mexico’s total imports of meat and cereal grains, including corn,[1] soybean, and wheat (Figure 2). Mexico’s current agricultural trade flows are largely reliant on the United States, which increases Mexico’s susceptibility to changes in the U.S. economy and—more specifically—changes in U.S. trade and foreign policies.
Mexico, however, could also benefit from changes in U.S. trade policies targeting other countries. For example, the U.S. trade war with China resulted in lower U.S. agricultural imports from China during the first quarter of 2019.[2] During the same period, imports from Mexico increased. If higher tariffs continue to be imposed on selected Chinese agricultural products, Mexico could potentially benefit through trade and investment diversion (Gantz, 2019).
Mexico has attracted international agricultural industries seeking its favorable weather, inexpensive labor, and favorable location relative to major global markets. NAFTA and other trade agreements have facilitated an influx of foreign direct investment (FDI) from international businesses, of which the United States represents the main source (CNIE, 2018). FDI from the United States has been largely propelled by friendly foreign investment provisions under NAFTA. Similar provisions are expected to be maintained under the new proposed USMCA (U.S. Department of Agriculture, 2019e). FDI has been a noteworthy generator of export activity, with a contribution to exports of approximately 29% (UNCTAD, 2018).[3] FDI in the agricultural sector represents less than 1% of total inflow; despite some year-to-year fluctuations, FDI has increased during the last decade (Figure 3).
Political changes and uncertainty regarding United States–Mexico trade and tariffs could inhibit future FDI inflows. To counter this uncertainty, Mexico was the first country to ratify the USMCA in June 2019. The U.S. Congress is expected to vote on the agreement in the next few months. On the other hand, uncertainty regarding trade relationships with China could also benefit Mexico as businesses seek lower tariffs and shipping costs. Some news reports suggest businesses have entertained the possibility of relocating to Mexico as an alternative to China while observing how trade issues and negotiations evolve (Townsend and Martin, 2019).
The Mexican government has made major investments in the agricultural sector. Through the Mexican Ministry of Agriculture, Livestock, Rural Development, Fishing and Food (SAGARPA), the government provides producer support (PS) to promote the competitiveness of the agricultural sector through a variety of programs (Wu et al., 2018). Annual PS averaged US$6.3 billion from 2000 to 2017, with a slight decline observed over the last three years (Figure 4). PS relative to the country’s gross farm receipts (GFR) has trended downward (Figure 4). When compared with the United States, Mexico’s PS as a share of GFR has been slightly higher during most of the years observed in Figure 4, demonstrating Mexico’s commitment to supporting its agricultural sector, which, while only a small share of the total economy, is of great importance to the country.
Currently, two combined programs—the Programa de Fomento a la Agricultura (Agriculture Promotion Program) and the Programa de Productividad y Competitividad Agroalimentaria (Agri-Food Productivity and Competitiveness Program)—provide incentives to promote the competitiveness of agriculture and food value chains through various program components (SADER, 2019). In general, these incentives are geared toward increasing the infrastructure capacity of the sector. For example, in 2019, the component of the program to increase capital investment in the agricultural sector has covered up to 50% of the investment cost (for up to US$0.2 million)[4] in protected agriculture projects,[5] mechanization of production and post-harvest activities, storage infrastructure, and improved seed genetics (SADER, 2019).[6] Agriculture support programs have benefited the entire sector but have stimulated growth in the specialty crop industry in particular.
Mexico’s spending on agricultural R&D has shown modest growth over 2000–2013 (IFPRI, 2019). R&D as a share of agricultural GDP (research intensity) remains at around 1%, below the United States and other high-income countries, which have an average research intensity of 2.47% (Heisey and Fuglie, 2018). Given the importance of R&D as a generator of productivity growth in the agricultural sector, higher investment in research may be needed to generate increased levels of productivity and innovation, particularly for sectors that are lagging.
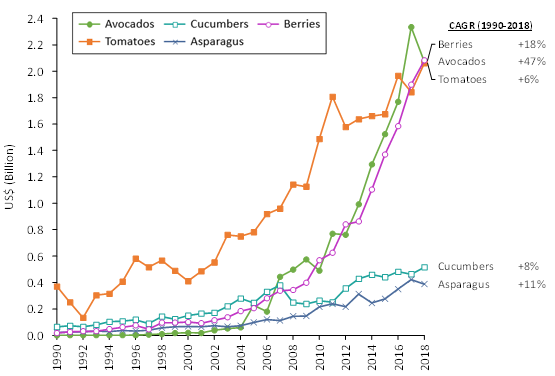
Data Source: U.S. Department of Agriculture (2019c).
Note: Avocados (HS 080440), tomatoes–fresh or chilled (HS 0702),
berries (HS 0810), cucumber (HS 0707), asparagus (HS 070920).
CAGR refers to compound annual growth rate.
A combination of climate and relatively lower production costs provides Mexico with a comparative advantage in the production of fruit and vegetables. Mexico is a large producer and exporter of fruit and vegetables and ranks in the top two for global exports of avocados, tomatoes, asparagus, limes, chili, cauliflower, and broccoli (SIAP, 2018b). The expansion in the production capacity of the specialty crop sector is attributable to increases in both the extensive margin (acreage) and intensive margin (yields). Within this sector, the protected agriculture and organic production segments have seen notable increases in productive capacity.
Subsidies invested in the specialty crop sector—coupled with lower labor costs—have resulted in an increase in production and exports to the United States (Figure 5), which in some cases compete with U.S. production, particularly in southern states (Wu et al., 2018). It has been argued that due in part to this competition, prices and production of fresh tomatoes in the United States have declined (Guan, Biswas, and Wu, 2017). Hodges et al. (2019) estimate that a continuation of this trend would further affect the fruit and vegetable industry (tomatoes, peppers, strawberries, etc.) in Florida and other southern states.
It is important to highlight that, while imports from Mexico may compete with U.S. production, U.S. consumers have benefited from the year-round availability of fruit and vegetables as a result of trade flows (Knutson et al., 2014). The per capita availability of fresh fruit and vegetables in the United States increased by 22% and 15% between 1990 and 2017, respectively (U.S. Department of Agriculture, 2019b). The increase in availability of some selected fruit and vegetables has been significant, such as fresh tomatoes (33%), bell peppers (90%), cucumbers (71%), strawberries (133%), and avocados (429%).

Data Source: SIAP (2015) and AMHPAC (2018). Authors’ own
calculations.
Note: Total protected area 104,877 acres = 42,442 hectares.
The production area classified as protected agriculture in Mexico increased at a compound annual growth rate (CAGR) of 28% during 2007–2017 (Figure 6). Currently, there are over 100,000 acres under protected agriculture, almost evenly divided among greenhouses, high tunnels, and shade houses. Protected agriculture has allowed producers to improve yields by increasing automation and year-round production while decreasing planted field area. One of the factors that has fueled this increase is the export potential of vegetables (U.S. demand), which has attracted both domestic and foreign capital (Bastida Tapia, 2017). In addition, the Mexican government has subsidized the adoption of protected agriculture as part of its producer support program (currently the Agriculture Promotion Program). In 2019, incentives for protected agriculture projects have been offered for up to 50% of the investment cost (SADER, 2019). However, these subsidies are not unique to Mexico. The United States offers similar cost-share programs that subsidize improvements to infrastructure in agricultural land through programs such as the Environmental Quality Incentives Program–High Tunnel Initiative (U.S. Department of Agriculture, 2019a).
Most of the subsidies for protected agriculture in Mexico have been allocated to tomato, pepper, and cucumber production. In 2017, tomatoes accounted for approximately 36% of the area under protected production followed by berries, bell peppers, and cucumbers (Figure 6). Trends have also shown a large increase in the area dedicated to berries since 2014. Protected technology allows producers to obtain better and more consistent quality and greater phytosanitary control for the export market. It is estimated that around 85% of protected production in Mexico is exported (Padilla-Bernal et al., 2008).

Data Source: SIAP (2017) and AMHPAC (2018).

Data Source: SIAP (2017).
Note: Projected production for 2030 from SAGARPA (2017a).
Total tomato production area (open-field and protected) in Mexico has decreased, but total production volume has increased due to infrastructure investments and productivity gains (Figure 7). Protected production area accounted for only 30% of the total tomato area but contributed approximately 63% of total production in 2017. According to projections, tomato production and export capacity could increase by 46% and 77%, respectively, from 2016 to 2024 (SAGARPA, 2017b). The country’s main strategies to increase the productivity of the industry include support to protected agriculture, improvements to irrigation technology, and investment in logistics and distribution infrastructure (SAGARPA, 2017b).
The avocado is one of Mexico’s main export crops and the second-highest generator of foreign income (SIAP, 2018b). Mexico contributed 48% of total world avocado exports in 2016, four times higher than in 1990 (FAOstat, 2018). After an import ban based on the risk of pest infestation was gradually removed from 1997 to 2007, exports to the United States spiked when all states were allowed to import avocados (Peterson and Orden, 2008). Exports to the United States have grown to a CAGR of 15% during the last decade (Figure 5). In 2018, Mexico supplied 87% of the avocados imported into the United States (U.S. Department of Agriculture, 2019c).
Mexican production of avocados grew by 4.7 times from 1980 to 2017, while the area allocated increased by only 3.3 times in the same period (Figure 8). This is a strong indicator of Mexico’s potential for avocado production as productivity levels continue to improve. It is estimated that Mexico has the potential to increase its avocado production from 2.03 million metric tons in 2017 to 3.16 million metric tons by 2030 (SAGARPA, 2017a). Mexico has developed a strategic plan covering the entire value chain. Production strategies include increased training in production, sustainable practices, sanitary standard certifications, and technologies to increase productivity. Other strategies include the promotion of avocado value-added enterprises and production and marketing organizations (UNCTAD, 2014; SAGARPA, 2017a). Export strategies include strengthening the market share of Mexican avocados in the United States, Canada, Japan, and China and expanding exports into the European market. The promotion of free trade agreements and standardization of phytosanitary measures are also part of the country’s overall strategic plan.
Mexico is one of the top producers of organic vegetables in the world. With 115,084 acres, Mexico has the second-largest production area after the United States (Dorais and Cull, 2017). Of this, it is estimated that 4,633 acres are protected production, mainly dedicated to organic tomato, cucumber, and pepper production (Dorais and Cull, 2017). Mexico is the leading exporter of organic products to the United States, with a share of around 10% (Demko et al., 2017). Mexico’s relevance in the organic sector could increase as demand for organic products continues to rise in developed markets (Barrett et al., 2002; Jaenicke, Dimitri, and Oberholtzer, 2011). The U.S. Department of Agriculture (USDA) estimates that there are more than 1,600 USDA-certified organic operations in Mexico that can export certified organic products into the United States (U.S. Department of Agriculture, 2018).
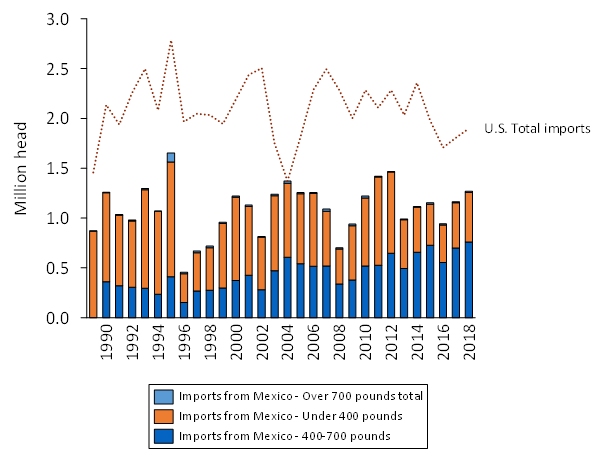
Data Source: U.S. Department of Agriculture (2019d).
Beef is the most important industry within the livestock sector in Mexico. Its cattle inventory, however, has remained relatively steady since the early 2000s (CEC, 2015) and only showed a moderate increase of 8% from 2008 to 2017 (SIAP, 2018a). Mexico and the United States have built a strong symbiotic relationship in the beef industry. Mexico, with its long growing season, extensive forage resources, and inexpensive labor, is an important global player in the cow–calf industry, while the United States, due to its corn production, has a comparative advantage relative to Mexico in finishing high-quality beef that is then exported worldwide. Mexico supplies the U.S. beef industry with enough cattle to allow feedlots to operate at or near capacity to maximize efficiency (Peel et al., 2011). By 2018, 67% of the cattle imported to the United States were supplied by Mexico (U.S. Department of Agriculture, 2019d). Mexico exports primarily steers and heifers to the United States (Figure 9), which are then placed in U.S. stocker operations for backgrounding or finished in U.S. feedlots (Peel et al., 2011).
Two decades ago, the Mexican beef industry focused its efforts on improving cattle quality and health, which allowed it to successfully respond to the increasing U.S. demand for cattle (Peel et al., 2010). The challenge for Mexico is remaining as the primary live cattle supplier for the United States. This will depend on its ability to continue meeting the quality, health, and breeding standards demanded by the U.S. market (Peel et al., 2011). As Mexico’s livestock production systems continue to intensify, productivity is expected to rise, increasing Mexico’s production and export capacity.
The agricultural sector in Mexico has grown over the past decade, but the country still faces challenges and unrealized opportunities. While larger, technology-intensive operations in Mexico are competitive and generally supply the export market, Mexico’s agricultural operations are predominantly small, with limited access to capital, infrastructure, and profitable markets.
The competitiveness of the sector could benefit from higher investment in rural infrastructure and business logistics to facilitate trade and commerce (UNCTAD, 2014).[7] The capacity to meet food safety, food labeling, and sanitary and phytosanitary standards seems to remain a barrier for some exporting companies in Mexico, particularly as new regulations such as the Food Safety and Modernization Act tighten verification restrictions for produce imported into the United States. While Mexico has made improvements in these areas, more investment in the country’s capacity to assist producers through extension education and for verification control is still needed (UNCTAD, 2014). In addition, the country’s R&D levels are low relative to other countries. More investment in research may be needed to support productivity growth in the sector.
Mexico’s proximity to the United States, coupled with a strong trade agreement, has opened doors for Mexico’s products into the United States, which has resulted in an increase in agricultural exports. However, the country’s dependency on the U.S. market also makes it vulnerable to foreign and trade policy changes in the United States. Currently, immigration issues have slowed trade discussions and the current U.S. administration’s positions on trade could affect Mexico’s agricultural sector. This uncertainty also impacts investment in the sector, which is key to sustaining growth (García-Winder and Chavarría, 2017).
In addition, uncertainty regarding the potentially protectionist policies of the new Mexican administration could reduce investors’ confidence in the country and stifle investment in the sector (Gantz, 2019). Since the inauguration of Mexican President Obrador in 2018, the administration has announced efforts to reduce Mexico’s dependence on U.S. imports, but questions remain regarding Mexico’s comparative advantage when producing grains, cereals, dairy, and meat. It is unclear how a sufficient level of mechanization and productivity can be achieved to increase domestic competitiveness against imports from the United States (Gantz, 2019). This will require further investment in building the productive capacity of these sectors. In 2019, the Mexican government launched a program targeting less developed rural communities to ensure access to fertilizers, credit, price guarantees, and other producer incentives (Haro, 2019; López Obrador, 2019). Some groups have criticized the program because it does not play to the comparative advantage of the country and is not designed to benefit larger-scale farmers, who are responsible for the majority of commercial production. A major concern is that these new policies have added more restrictions and created uncertainty in the agricultural sector, which could prevent large-scale producers from planning in the long term (Blanco, 2019).
Some subsectors within Mexican agriculture have significant production and growth potential. Government support and FDI have resulted in the capitalization of some agricultural industries and propelled the growth in production capacity and trade. For example, the area under protected agriculture has expanded significantly and the production and export of tomatoes, berries, and other vegetables have enjoyed considerable growth. In addition, the avocado industry has developed substantially during the last two decades and exports to the United States have sharply increased. The importance of the avocado industry in Mexico cannot be underestimated, as it has become the second-largest generator of foreign income and has additional expansion capacity.
Nonetheless, challenges still abound in Mexico, where greater investment in infrastructure, business logistics, access to production inputs, and credit is needed. Mexico’s trade dependency on the United States and uncertainty regarding the policy direction of the new Mexican and U.S. administrations could affect investment. Mexico, however, could benefit from trade and investment diversion as a result of United States–China trade disputes.
Ahmed, L. 2018. “U.S. Corn Exports to Mexico and the North American Free Trade Agreement.” USITC Working Paper. Washington, DC: U.S. International Trade Commission. Available online: https://www.usitc.gov/publications/332/working_papers/ahmed.htm. Accessed July 2019.
Asociación Mexicana de Horticultura Protegida (AMHPAC). 2018. Portal de Negocios y Mercados. Available online: http://amhpac.org/negociosymercados/socios/produccion/. Accessed June 2019.
Barrett, H.R., A.W. Browne, P.J.C. Harris, and K. Cadoret. 2002. “Organic Certification and the UK Market: Organic Imports from Developing Countries.” Food Policy 27(4): 301–318.
Bastida Tapia, A. 2017. “Evolución y Situación Actual de la Agricultura Protegida en México.” Sexto Congreso Internacional de Investigación en Ciencias Básicas y Agronómicas. Available online: http://dicea.chapingo.mx/wp-content/uploads/2018/05/MEMORIA_MESA_3_2_CONGRESO2017.pdf
Blanco, D. 2019, March 29. “Incentivos de AMLO Dejan Fuera a Grandes Agricultores y se ‘Prenden’ las Alarmas en el Sector.” El Financiero. Available online: https://www.elfinanciero.com.mx/economia/incentivos-de-amlo-dejan-fuera-a-grandes-agricultores-y-se-prenden-las-alarmas-en-el-sector. Accessed July 2019.
Commission for Environmental Cooperation (CEC). 2015. North American Ranching Industries, Beef Cattle Trade, and Grasslands: Status and Trends. Montreal, Canada: Commission for Environmental Cooperation.
Comisión Nacional de Inversiones Extranjeras (CNIE). 2018. Informe Estadístico sobre el Comportamiento de la Inversión Extranjera Directa en México (Enero–Marzo de 2018). Available online: https://www.gob.mx/cms/uploads/attachment/file/442866/Informe_Congreso-2018-4T.pdf. Accessed June 2019.
Demko, I., R. Dinterman, M. Marez, and E. Jaenicke. 2017. “Report of the Organic Trade Association: U.S. Organic Trade Data: 2011 to 2016.” Available online: https://ota.com/tradedata. Accessed August 2019.
Dorais, M., and A. Cull. 2017. “Organic Protected Horticulture in the World.” Acta Horticulturae 1164: 9–22.
FAOStat. 2018. Data: Crop and Livestock Products. Available online: http://www.fao.org/faostat/en/#data/TP. Accessed June 2019.
Gantz, D.A. 2019. “The U.S.-Mexico Trade Relationship under AMLO: Challenges and Opportunities.” Arizona Legal Studies Discussion Paper No. 19-06. Houston, TX: Mexico Center, Rice University's Baker Institute for Public Policy. Available online: https://ssrn.com/abstract=3377591.
García-Winder, M., and H. Chavarría (eds.). 2017. “The Outlook for Agriculture and Rural Development in the Americas: A Perspective on Latin America and the Caribbean 2017-2018.” ECLAC, FAO, IICA. Available online: https://repositorio.cepal.org/handle/11362/42282. Accessed June 2019.
Guan, Z., T. Biswas, and F. Wu. 2017. “The US Tomato Industry: An Overview of Production and Trade.” Publication #FE1027. Gainesville, Florida: University of Florida. Institute of Food and Agricultural Sciences. Available online: https://edis.ifas.ufl.edu/fe1027. Accessed June 2019.
Haro, L.F. 2019, January 7. “Presupuesto para el Campo 2019.” Inforural. Available online: https://www.inforural.com.mx/presupuesto-para-el-campo-2019/. Accessed July 2019.
Heisey, P.H., and K.O. Fuglie. 2018. Agricultural Research Investment and Policy Reform in High-Income Countries. Washington, DC: U.S. Department of Agriculture, Economic Research Service, Economic Research Report ERR-249, May.
Hodges, A., C. Court, R. Clouser, L. House, Z. Guan, F. Wu, S. Li, and T. Luo. 2019. “Potential Economic Impacts in Florida of Increased Imports of Mexican Fruits and Vegetables.” Gainesville, FL: University of Florida, Institute of Food and Agricultural Sciences, Economic Impact Analysis Program. Available online: https://fred.ifas.ufl.edu/pdf/economic-impact-analysis/MexicoFruit&Vegetable.pdf. Accessed June 2019.
International Food Policy Research Institute (IFPRI). 2019. Agricultural Science and Technology Indicators: Mexico. Available online: https://www.asti.cgiar.org/mexico?country=MEX&lang=en. Accessed June 2019.
International Trade Center (ITC). 2019. Trade Map. List of products at 4 digits level exported by Mexico in 2018. Available online: https://www.trademap.org/Product_SelProductCountry.aspx?nvpm=1%7c484%7c%7c%7c%7cTOTAL%7c%7c%7c4%7c1%7c1%7c2%7c1%7c1%7c1%7c1%7c1. Accessed May 2019.
Jaenicke, E., C. Dimitri, L. Oberholtzer. 2011. “Retailer Decisions about Organic Imports and Organic Private Labels.” American Journal of Agricultural Economics 93(2): 597–603.
Knutson, R.D., M.A. Palma, M. Paggi, J. Seale, L.A. Ribera, and D. Bessler. 2014. “Role of Trade in Satisfying U.S. Fresh Fruit and Vegetable Demand.” Journal of International Food & Agribusiness Marketing 26(4): 326–343.
López Obrador, A.M. 2019. Impulso al Sector Agropecuario y Pesquero. Conferencia Presidente AMLO [YouTube video, 2:11:54]. Available online: https://www.youtube.com/watch?time_continue=12&v=sZeFYGfL5LQ. Accessed July 2019.
Organisation for Economic Co-operation and Development (OECD). 2018. “Producer and Consumer Support Estimates.” OECD Agriculture Statistics (database). Available online: https://stats.oecd.org/viewhtml.aspx?QueryId=84839&vh=0000&vf=0&l&il=&lang=en#. Accessed May 2019.
Padilla-Bernal, L.E., A.F. Rumayor-Rodríguez, and O. Pérez- Veyna. 2008. La Competitividad Sistémica de la Industria del Tomate de Agricultura Protegida en Zacatecas. Mercados y Negocios 18(9): 38–59.
Peel, D.S., R.J. Johnson, and K.H. Mathews. 2010. Cow-Calf Beef Production in Mexico. Washington, DC: U.S. Department of Agriculture, Economic Research Service, Outlook Report LDP-M-186-01, November.
Peel, D.S., K.H. Mathews, and R.J. Johnson. 2011. Trade, the Expanding Mexican Beef Industry, and Feedlot and Stocker Cattle Production in Mexico. U.S. Department of Agriculture, Economic Research Service, Outlook Report LDP-M-206-01, August.
Peterson, E.B., and D. Orden. 2008. “Avocado Pests and Avocado Trade.” American Journal of Agricultural Economics 90(2): 321–335.
Secretaría de Agricultura y Desarrollo Rural (SADER). 2019. “Acuerdo por el que se dan a Conocer las Reglas de Operación del Programa de Fomento a la Agricultura de la SADER para el Ejercicio 2019.” Diario Oficial de la Federación, sixth session. Available online: https://www.gob.mx/cms/uploads/attachment/file/447280/Programa_de_Fomento_a_la_Agricultura.pdf. Accessed June 2019.
Secretaría de Agricultura, Ganadería, Desarrollo Rural, Pesca y Alimentación (SAGARPA). 2017a. Planeación Agrícola Nacional 2017-2030: Aguacate Mexicano. Available online: https://www.gob.mx/cms/uploads/attachment/file/257067/Potencial-Aguacate.pdf. Accessed June 2019.
Secretaría de Agricultura, Ganadería, Desarrollo Rural, Pesca y Alimentación (SAGARPA). 2017b. Planeación Agrícola Nacional 2017-2030: Jitomate Mexicano. Available online: https://www.gob.mx/cms/uploads/attachment/file/257077/Potencial-Jitomate.pdf. Accessed June 2019.
Secretaría de Economía. 2015. Comercio Exterior/Países con Tratados y Acuerdos Firmados con México. Available online: https://www.gob.mx/se/acciones-y-programas/comercio-exterior-paises-con-tratados-y-acuerdos-firmados-con-mexico. Accessed June 2019.
Secretaría de Economía. 2018. Tratado de Libre Comercio México - Unión Europa Modernizado Capitulado. Available online: https://www.gob.mx/tlcuem. Accessed June 2019.
Servicio de Información Agroalimentaria y Pesquera (SIAP). 2015. Datos Abiertos. Estadística de Producción Agrícola. Superficie Cubierta y Número de Instalaciones de Agricultura Protegida. Available online: http://infosiap.siap.gob.mx/gobmx/datosAbiertos.php. Accessed June 2019.
Servicio de Información Agroalimentaria y Pesquera (SIAP). 2017. Anuario Estadístico de la Producción Agrícola. Available online: https://nube.siap.gob.mx/cierreagricola/. Accessed June 2019.
Servicio de Información Agroalimentaria y Pesquera (SIAP). 2018a. Acciones y Programas. Available online: https://www.gob.mx/siap/acciones-y-programas/produccion-pecuaria. Accessed June 20, 2019.
Servicio de Información Agroalimentaria y Pesquera (SIAP). 2018b. 2012-2018 Food & Agricultural Atlas. Available online: https://nube.siap.gob.mx/gobmx_publicaciones_siap/pag/2018/Agricultural-Atlas-2018. Accessed June 2019.
Townsend, M., and E. Martin. 2019, March 27. “U.S. and China Got into a Trade War—and Mexico Walked Away Richer.” LA Times.
UN Comtrade Database, International Trade Center. 2018. Bilateral Trade between Mexico and United States of America. Available online: https://www.trademap.org/(X(1)S(0qmevxbdmnsvho55lq5hms55))/tradestat/Bilateral_TS.aspx. Accessed June 2019.
United Nations Conference on Trade and Development (UNCTAD). 2014. Mexico's Agricultural Development: Perspectives and Outlook. New York, NY, and Geneva: United Nations.
United Nations Conference on Trade and Development (UNCTAD). 2018. World Investment Report 2018: Investment and New Industrial Policies. New York, NY, and Geneva: United Nations.
U.S. Department of Agriculture. 2018. International Trade with Mexico. Washington, DC: U.S. Department of Agriculture, Agricultural Marketing Service. Available online: https://www.ams.usda.gov/services/organic-certification/international-trade-mexico. Accessed June 2019.
U.S. Department of Agriculture. 2019a. Financial Assistance–Environmental Quality Incentives Program. Washington, DC: U.S. Department of Agriculture, Natural Resource Conservation Service. Available online: https://www.nrcs.usda.gov/wps/portal/nrcs/main/national/programs/financial/eqip/. Accessed August 2019.
U.S. Department of Agriculture. 2019b. Food Availability (per Capita) Data System. Washington, DC: U.S. Department of Agriculture, Economic Research Service. Available online: https://www.ers.usda.gov/data-products/food-availability-per-capita-data-system/. Accessed August 2019.
U.S. Department of Agriculture. 2019c. Historical FAS USTrade Online selections. Washington, DC: U.S. Department of Agriculture, Foreign Agricultural Service. Available online: https://apps.fas.usda.gov/gats/ExpressQuery1.aspx. Accessed June 2019.
U.S. Department of Agriculture. 2019d. Livestock and Meat International Trade Data. Cattle: Annual and Cumulative Year-to-Date U.S. Trade - All Years and Countries. Washington, DC: U.S. Department of Agriculture, Economic Research Service. Available online: https://www.ers.usda.gov/data-products/livestock-and-meat-international-trade-data/. Accessed June 2019.
U.S. Department of Agriculture. 2019e. Mexico Trade & FDI. Washington, DC: U.S. Department of Agriculture, Economic Research Service. Available online: https://www.ers.usda.gov/topics/international-markets-us-trade/countries-regions/nafta-canada-mexico/mexico-trade-fdi/. Accessed June 2019.
World Bank. 2019. Agriculture, Forestry, and Fishing, Value Added (% of GDP). Available online: https://data.worldbank.org/indicator/NV.AGR.TOTL.ZS?locations=MX. Accessed June 2019.
Wu, F., B. Qushim, M. Calle, and Z. Guan. 2018. “Government Support in Mexican Agriculture.” Choices 33(3):1–11.
[1] Ahmed (2018) argues that U.S. exports of white corn (mostly for human consumption) to Mexico have negatively affected Mexican producers, while U.S. exports of yellow corn have benefited the development of the livestock sector.
[2] Monthly imports of agricultural products from China and Mexico from U.S. Department of Agriculture, Foreign Agricultural Service, Global Agricultural Trade System: https://apps.fas.usda.gov/gats/ExpressQuery1.aspx.
[3] Measured as the share of foreign value added in exports.
[4] 4 million pesos, using a 2019 exchange rate of US$1 to 19.16709 Mexican pesos.
[5] “Protected agriculture” indicates crops produced under protective structures such as greenhouses, high tunnels, shade houses, etc.
[6] See Wu et al. (2018) for a detailed review of Mexico’s subsidy structure in previous years.
[7] UNCTAD (2014) estimates that logistical costs in Mexico could double those observed in the United States.

