In 2018, the U.S. agricultural sector was hit by retaliatory tariffs that China and other major trading partners implemented in response to U.S. actions undertaken in Section 232 investigations on steel and aluminum and Section 301 investigation of China’s policies related to technology transfer and intellectual property. The U.S. pork sector was especially hard hit, as China and Mexico imposed retaliatory tariffs of 25% and 20%, respectively, in response to U.S. Section 232 actions and an additional 25% in response to U.S. Section 301 action. As a result, total applied tariffs on selected U.S. pork products to these two markets ranged from 20% to 80%.
China and Mexico are major importers of U.S. pork, accounting for nearly 32% of U.S. pork and pork product exports, valued at over $1.98 billion. In 2017, China sourced nearly 13% of its pork and pork product imports by value from the United States, while U.S. pork and pork products accounted for 89% of Mexico’s pork imports (Trade Data Monitor, 2019).
Figure 1. Timeline of U.S. Sections 232 and 301 and
Ensuing Retaliations
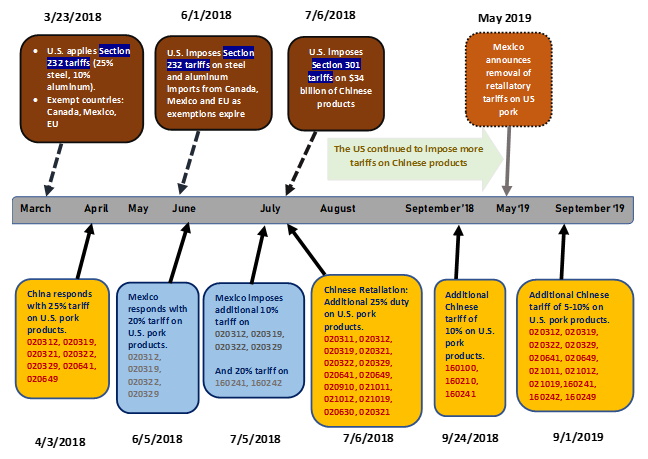
Source: Authors’ compilation.
U.S. pork and pork products in all the major categories were affected by the retaliatory tariffs. Figure 1 presents a timeline for the imposition and retaliation activity by the United States, Mexico and China. Eighteen pork products (using the Harmonized System 6-digit (HS-6) code) were affected. China imposed retaliatory tariffs of 25% on April 3 and additional tariffs on July 6, 2018, September 24, 2018, and September 1, 2019. In some instances, the same products were hit either twice or thrice by China’s retaliatory tariffs.
Mexico responded with tariffs on pork ranging from 10% to 20% on June 5, 2018 and established a tariff rate quota (TRQ) of 350,000 metric tons for Harmonized System (HS) Codes 0203.12.01, 0203.19.99, 0203.22.01, and 0203.29.99. One month later, on July 5, 2018, those products with a 20% tariff then faced an additional 10% tariff.
In addition to the retaliatory tariffs, global pork markets were affected by another major shock: the outbreak of African Swine Fever (ASF) in China. ASF is a severe, highly contagious viral disease affecting domestic and wild pigs. The first outbreak of ASF was confirmed on August 3, 2018. Since then, China has reported 158 outbreaks to the World Organization for Animal Health (as of October 3, 2019), with official losses of 1.2 million animals reported (FAO, 2019). However, the reported losses are small relative to China’s total herd size of over 400 million head; according to a Reuters news report, culling may have been far heavier than reported (Patton and Gu, 2019). Accounting for nearly half of the world’s hogs, and the top pork producer and consumer (USDA, 2019), expectations of higher Chinese demand for imports have driven growth in global pork prices.
This paper takes an in-depth look at how retaliatory tariffs have affected U.S. and global pork trade over the past year. Assessing the impacts of tariffs is challenging given the import demand shock in China resulting from ASF. To provide some insights, we examine changes in U.S. pork exports to China and Mexico, referred to as “trade deltas,” following the imposition of the tariffs. We then perform an ex ante analysis using an Almost Ideal Demand System estimation. This empirical assessment provides evidence of the impact of the tariffs prior to the outbreak of ASF, thereby isolating its impact from the tariffs. We then compare the ex ante estimates to trade deltas that have since been observed following the tariffs, which are however confounded by ASF.
We first examine changes in U.S. pork exports to retaliatory partners that occurred following the imposition of the retaliatory duties. We use a simple calculation of the before and after change in U.S. pork exports, or trade delta, by comparing average monthly pork exports to China and Mexico for the 15 months prior to the retaliatory tariffs with the 15-month period after imposing the tariffs. We recognize that examining trade deltas only provides a simple before and after statistic that does not account for other factors, namely ASF. We further note that the trade deltas are sensitive to the period defined under the before and after change.
Table 1. Trade Delta: Before and After Change in
All Pork and Pork Product Exports to China Post
Retaliation, April 2018–June 2019
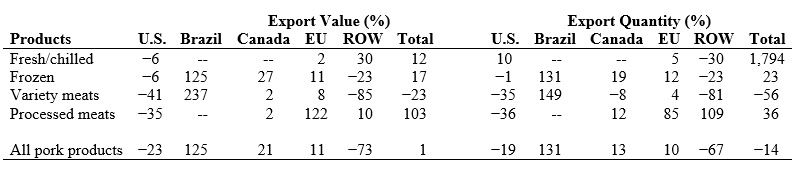
Source: Authors’ calculations using Trade Data Monitor (2019).
Note: For ease of analysis we group these products into four broad
categories —fresh/chilled (0203.11, 0203.12, 0203.19), frozen
(0203.21, 0203.22, 0203.29), variety meats (0206.30, 0206.41, 0206.49)
and processed meats (0209.10, 0210.11, 0210.12, 0210.19, 1601.00,
1602.41, 1602.41, 1602.42, 1602.49). ROW indicates rest of world.
Table 2. Trade Delta: Before and After Change in
All Pork and Pork Product Exports to Mexico Post
Retaliation, June 2018–July 2019
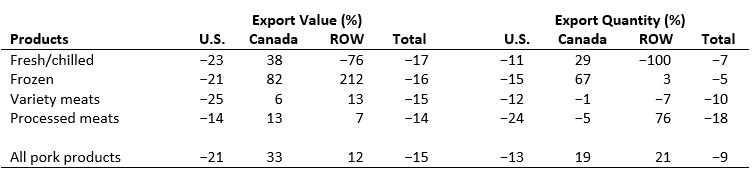
Source: Authors’ calculations from Trade Data Monitor (2019).
Note: ROW indicates rest of world.
Figure 2. Monthly U.S. Pork Exports to China,
January 2017–June 2019
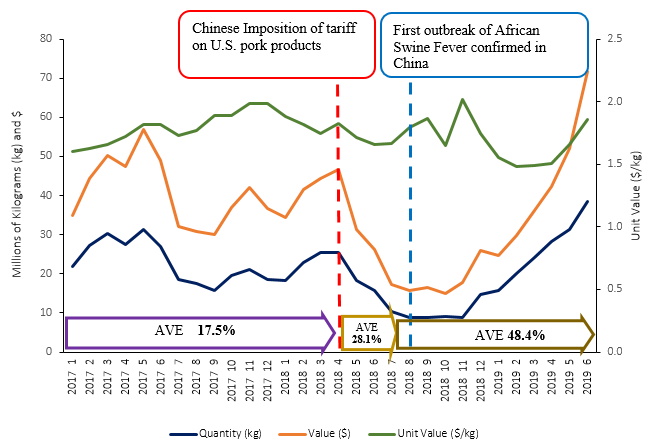
Source: Authors’ calculations using data from International Trade
Centre (2019) Market Access Map.
Note: AVE is estimated as the simple average ad valorem equivalent
of Chinese tariffs on U.S. pork products; April 2018, 28.1%; July 2018,
48%; and September 2019, 54.9%.
Figure 3. China Weekly Hog–Pork–Pig Prices,
January 2017–September 2019
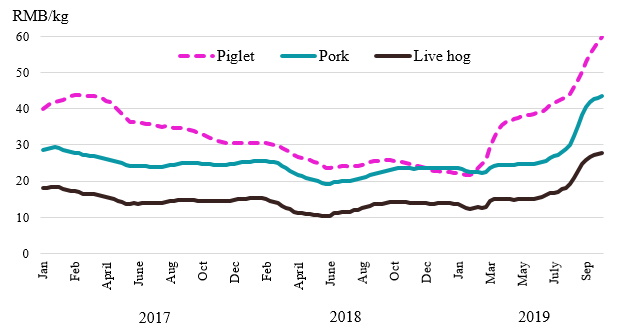
Source: Ministry of Agriculture and Rural Affairs China (2019).
Table 3. Price Elasticities for China Pork Imports,
2001–2017
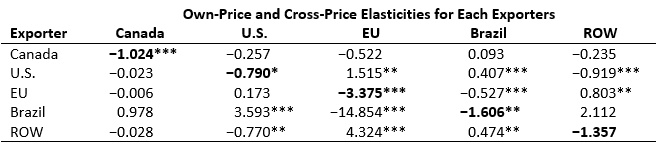
Source: Authors’ calculations using the Trade Data Monitor (2019).
Note: Single, double, and triple asterisks (*, **, ***) denote significance
at the 10%, 5%, and 1% levels, respectively. ROW indicates rest of world.
Table 4. Price Elasticities for Mexico Pork Imports,
2001–2017
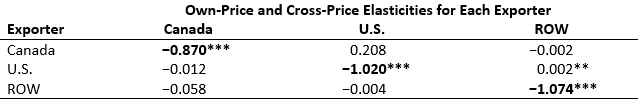
Source: Authors’ calculations using Trade Data Monitor (2019).
Note: Single, double, and triple asterisks (*, **, ***) denote significance
at the 10%, 5%, and 1% levels, respectively. ROW indicates rest of world.
Figure 4. Trade Delta versus Simulated Change in Pork and
Pork Products Import Quantity by China and Mexico Post
Retaliation
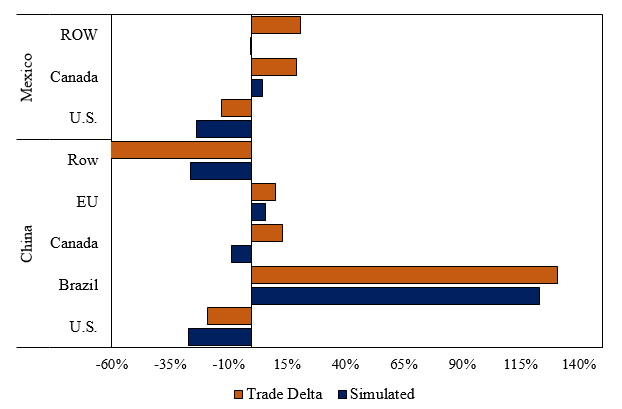
Source: Authors’ calculation using Trade Data Monitor (2019).
Table 1 shows the before and after change in U.S. pork and pork product exports to China post-retaliation. On average, all U.S. pork and pork product exports to China declined 23% by value. Declines were seen in all the product groups except fresh and chilled pork. U.S. variety meat exports saw the largest percentage decline in quantity (−35%) and value (−41%), followed by processed meats (−35% and -36%, respectively), and frozen meat exports (−6% and −1%, respectively). Despite the tariffs, export quantities of U.S. fresh and chilled pork (representing less than 0.1% of U.S. pork exports to China) increased by 10% but saw a decline of 6% in value.
Brazil appeared to be the likely beneficiary of these retaliatory tariffs, especially frozen pork (+125%) and variety meats (+237%). Canada also showed a slight increase in value of exports to China for its frozen (27%), variety (2%), and processed meats (2%). Interestingly, the value of exports to China from the rest of the world also declined (−73%) under retaliatory tariffs, while exports from the European Union (EU), the top global exporter of pork to China, increased by 11%. Tariffs on U.S. pork were introduced at a time when Chinese domestic production was expanding and hog prices were low. However, pork imports from the United States have always shown a long-term uptrend. The outbreak of ASF in China in August 2018 saw the culling and destruction of segments of the domestic pig population. Despite this animal disease outbreak, import demand was muted and actually fell during 2018.
Table 2 presents the before and after change in pork and pork product exports to Mexico post-retaliation. On average, U.S. exports of all pork products to Mexico declined 15% in value but only 9% in quantity. This would suggest that Mexico imported a greater mix of lower-value meat after imposing retaliatory tariffs. The declines in value of U.S. exports to Mexico were evenly distributed across pork product varieties. Fresh/chilled and frozen meat exports declined in value by 23% and 21%, respectively, while variety meat exports declined 25%. Processed meat saw a 14% decline in exports from the United States. Canada was the biggest beneficiary from Mexico’s retaliatory tariffs. Canada’s overall pork exports to Mexico expanded by 33% in value, with fresh/chilled (38%) and frozen (82%) pork categories showing the largest increases.
It is important to note that “before and after” trade change does not account for other exogenous factors that can influence trade. Further, trade change calculations are highly sensitive to time frame. For instance, comparing a 12-month rolling average prior to tariffs to the 12 months post-tariff imposition, U.S. pork exports to China fell by 35% and 40% in quantity and value, respectively. However, using a 15-month time frame, U.S. pork exports to China fell by 23% and 19% in quantity and value, respectively. This suggests that other factors beyond the tariff, particularly ASF, may have impacted the decline in exports to China even in the face of prohibitive retaliatory tariffs on U.S. pork products. The 15-month time frame included three additional months of culling due to the spread of ASF and clearly resulted in a greater need for imported pork. As shown in Figure 2, monthly U.S. pork exports to China during months when it was impacted by retaliatory tariffs were relatively weak, but after ASF was confirmed, monthly U.S. exports to China accelerated during the latter part of 2018 and the first half of 2019.
This increase in U.S. pork exports to China occurred despite the tariffs and reflects the significant impact ASF had on Chinese pork production and prices. As culling from ASF continued and Chinese pork supply tightened, domestic prices trended upwards. Figure 3 shows an inflection point in China’s pig, pork, and live hog prices in February 2019, which almost doubled by September 2019. While retaliatory tariffs on U.S. pork limited shipments during 2018 and the beginning of 2019, steep gains in Chinese pork prices have increased the price competitiveness of U.S. pork, even with retaliatory tariffs in place.
A number of studies have looked at the ex ante impact of retaliatory tariffs on U.S. agricultural commodities (Muhammad and Smith, 2018; Taheripour and Tyner, 2018; Zheng, et al., 2018; Elobeid et al., 2019), all of which have shown some level of U.S. exports decline. To gain further insights into Chinese and Mexican demand for U.S. pork after exposure to retaliatory tariffs, we employ the nonlinear Almost Ideal Demand System (NAIDS) model specified by Deaton and Muellbauer (1980). We estimate China and Mexico’s short-run pork import demand parameters, compute corresponding source-based elasticities, and assess the impacts of the retaliatory tariffs on pork trade. The analysis does not directly address the range of supply issues that may impact the ability of any source country to export pork products. Instead, we assume that supply from each model country/region is perfectly elastic and that Chinese and Mexican importers (wholesalers) determine the quantities to be imported from individual countries based on product market prices and consumer preferences.
Chinese and Mexican importers are expected to pay a higher price for imported U.S. pork and pork products when retaliatory duties are in place. Higher prices make U.S. pork and pork products less competitive relative to imports from other countries. Higher prices of imported products from the United States are expected to result in “real” expenditure decreases of China and Mexican pork products. Since all competing countries will likely have a relative price advantage from the tariff increase on U.S. pork, we must consider both own- and cross-price effects. Cross-country competitiveness assumes that similar products are differentiated by country of origin. The elasticity of demand for aggregate imports is derived from the share of the imported products in the market. We derive the impacts of retaliatory tariffs for imported pork in China and Mexico by multiplying the calculated own- and cross-price elasticities by the corresponding specified tariff increases.
We obtained export quantities and expenditures for each HS-6 pork product from Trade Data Monitor (2019) (https://www.tradedatamonitor.com/). All import expenditures are on a free on board (FOB) basis. Using expenditures and quantities, we calculated per unit values ($/kg) for each commodity. Due to the persistence of zero imports of some of the HS-6 commodities for several months, we summed the data across all HS-6 products to derive total pork exports to Mexico and China from all trading partners.
Tables 3 and 4 present the own- and cross-price elasticities for imported pork products in China and Mexico, respectively. China is relatively price responsive to pork imports, with own price elasticities ranging from −0.790 to −3.375, but it is the least responsive to price changes in U.S. pork product imports. However, China is highly responsive to price changes in imports from the European Union and Brazil. Mexico’s price response to imports from the United States, on the other hand, is more muted, with almost equal percentage changes in price resulting from a change in pork imports from all trading partners.
Figure 4 compares the before and after change in pork product quantity imported by Mexico and China with the ex ante simulated change in import quantity. The ex ante model provided reasonable predictions of the directional changes in imports but in many cases underestimated the before and after change in imports. For instance, the ex ante simulated changes in Mexico’s import quantity from the rest of the world (+ 0.1%) and from Canada (+4.8%) were lower than the before and after estimated average change in imports of +21% and +19%, respectively. Likewise, the average changes in China’s imports from the rest of the world (−67%), EU (+10%), Canada (13%), and Brazil (131%) were also higher (in absolute value) than the ex ante simulated changes in import quantity: −26.4, +5%, −8.8%, and +123%, respectively. The higher-than-expected increase in imports observed ex post is likely attributed to increasing China import demand stemming from ASF.
However, in the case of imports from the United States, the before and after trade delta tends to be lower than the ex ante model simulated changes in imports. For example, the before and after changes in China’s and Mexico’s imports of U.S. pork are −19% and −13% in quantity, respectively, and are smaller, in absolute value, than the ex ante simulated decreases in the quantity imported of −27.1% and −23.6%, respectively. The higher-than-expected model estimated Chinese imports from the United States suggests that U.S. pork exports under the confounding influence of China’s ASF outbreak would likely result in significantly higher exports had the retaliatory tariffs not been in place.
In the case of Mexico, the higher percentage change in trade delta compared to the ex ante model result likely reflects high substitutability between Canadian and U.S. pork. Canadian processors were able to expand market share in Mexico but remained limited by supplies relative to U.S. processors. Other exporters to Mexico, mainly the European Union, benefited from the establishment of a duty-free tariff rate quota for pork which lowered the effective duty from a most favored nation rate of 20% to 0%. However, the smaller-than-expected decrease in Mexico’s imports of U.S. pork is likely because Mexico is less price sensitive to U.S. fresh/chilled and variety meats.
We employed the NAIDS model and estimated China and Mexico’s short-run pork import demand parameters, the corresponding source-based elasticities, and assessed the impacts of the retaliatory tariffs on pork trade. Based on our analysis, both Mexico and China’s quantities of imports from the United States were lower because of the retaliatory tariffs. However, the decrease in Chinese imports from the United States was confounded by the outbreak of ASF, which led to a significant drop in Chinese pork production. Declining domestic hog supply in China due to losses from ASF resulted in an increase in demand for imported pork. While this may have had the effect of supporting U.S. exports, the amount of U.S. pork exported to China would have been higher had the retaliatory tariffs not been in place.
The USDA forecasts that China’s swine production will decline 28% by the end of 2019 and a further 11% by the end of 2020 due to losses from ASF and the exit of producers from the industry (USDA, 2019). China’s Ministry of Agriculture and Rural Affairs reported that the sow herd fell 38% year-over-year in August 2019 (MARA, 2019). The continued decline of the sow herd implies a reduction in pig supply for the remainder of 2019 and 2020. Although recent gains in hog and pork prices will encourage producers to begin restocking herds, ASF remains a significant hurdle as efforts to contain the disease appear to be unsuccessful. It may take several years, or the introduction of an effective vaccine for the disease, to be fully controlled. Imports of pork products from the United States or other countries may bolster supply in China and lessen internal price pressure. However, China’s pork imports from the United States will be constrained as long as retaliatory tariffs remain in place.
Deaton, A. S., and J. Muellbauer. 1980. “An Almost Ideal Demand System.” American Economic Review 70: 312–326.
Elobeid, A., M. Carriquiry, D. Swenson, and D. Hayes. 2019. “Analysis of the Effects of Chinese and Mexican Retaliatory Tariffs on Select U.S. Agricultural Commodities on U.S. and Global Markets.” Paper presented at the annual meeting of the Agricultural and Applied Economics Association, Atlanta, GA, July 21–23.
Food and Agricultural Organization of the United Nations (FAO). 2019, October 3. Situation Update. Rome, Italy: Food and Agricultural Organization of the United Nations (FAO), Agriculture and Consumer Protection Department, Animal Production and Health. Available online: http://www.fao.org/ag/againfo/programmes/en/empres/ASF/situation_update.html.
International Trade Centre. 2019. Market Access Map. Available online: https://www.macmap.org/ [Accessed 05/15/2019].
Ministry of Agriculture and Rural Affairs-China (MARA). 2019. Information on Live Pigs in September 2019. Available online: http://www.gov.cn/shuju/2019-10/12/content_5438985.htm [Accessed 11/01/2019].
Muhammad, A., and A. Smith. 2018. Evaluating the Impact of Retaliatory Tariffs on U.S. Soybeans in China. Knoxville, TN: University of Tennessee Extension, Institute of Agriculture, Report W 532. Available online: https://extension.tennessee.edu/publications/Documents/W532.pdf.
Patton, D., and H. Gu. 2019, June 29. “Swine Fever Toll in China May Be Twice as High as Reported, Industry Insiders Say.” Reuters Business News.
Taheripour, F., and W. E. Tyner. 2018. “Impacts of Possible Chinese 25% Tariff on U.S. Soybean and Other Agricultural Commodities.” Choices 33(2): 1–8.
Trade Data Monitor (TDM). 2019. Available online: www.tradedatamonitor.com.
U.S. Department of Agriculture. 2019, October 10. Livestock and Poultry: World Markets and Trade. Washington, DC: U.S. Department of Agriculture, Foreign Agricultural Service. Available online: https://apps.fas.usda.gov/psdonline/circulars/livestock_poultry.pdf.
Zheng, Y., D. Wood, H. H. Wang, and J. P. H. Jones. 2018. “Predicting Potential Impacts of China’s Retaliatory Tariffs on the U.S. Farm Sector.” Choices 33(2): 1–6.

