Continuing trade turmoil among the United States, China, and several other countries has led to retaliatory tariffs targeting U.S. agricultural exports, including tree and vine crops (also called perennial crops) (Regmi, 2019). Specifically, China imposed retaliatory tariffs on U.S. fruits, including apples, cherries, oranges, and grapes (including raisins and wine). Apple exports to India and Mexico were also subject to retaliatory tariffs, although Mexico removed these tariffs in May 2019 and India did not impose retaliation until June 2019. Starting in 2018, all major U.S. tree nuts—including almonds, pistachios, walnuts, and pecans—also faced significant retaliatory tariffs in China and (to a lesser extent) Turkey. India imposed retaliatory tariffs on almonds and walnuts in June 2019.
We summarize the complex pattern of retaliatory tariff increases across tree nut products and review how these trade barriers affect U.S. exports to these markets and the complex economic relationships that complicate isolating the economic impacts of retaliation. We offer preliminary assessments of market impacts using data on export quantities and values in relation to U.S. domestic production.
Source: U.S. Department of Agriculture, Global Agricultural
Information Network (GAIN) Reports, multiple years.
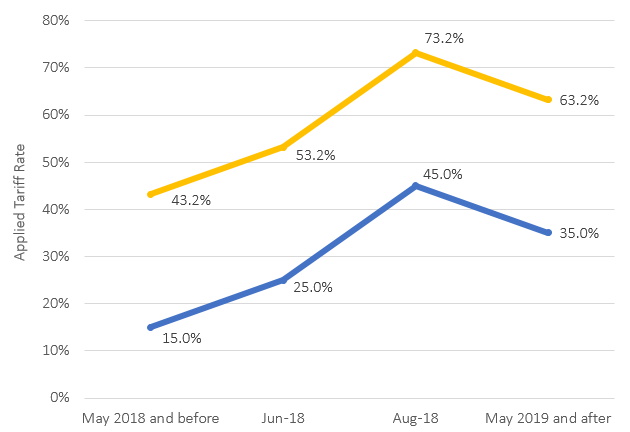
Note: Blue is almonds and walnuts; Gold is pecans and pistachios.
Source: USDA 2019g, USDA 2018b and USDA 2018c.
Source: USDA 2019b, USDA 2018a
Note: Tariff rate changes were for almonds were calculated using the
exchange rate for Indian rupees per dollar on June 16, 2019, the day
new applied tariff rates went into effect.
Source: Production data comes from USDA NASS QuickStats.
Trade data comes from USITC DataWeb, based on U.S.
Department of Commerce, Census Bureau data.
Notes: These data are annual calendar-year production and
exports and much export of each crop occurs in the following
calendar year. Reported shares ofexports to China include
exports to Hong Kong and Vietnam.

Source: Production data comes from USDA NASS QuickStats.
Trade data comes from USITC DataWeb, based on U.S.
Department of Commerce, Census Bureau data.
Note: 2015–2018 represents the average share of export for
marketing years 2015/2016 through 2017/2018.
Source: Trade data comes from USITC DataWeb, based on
U.S. Department of Commerce, Census Bureau data.
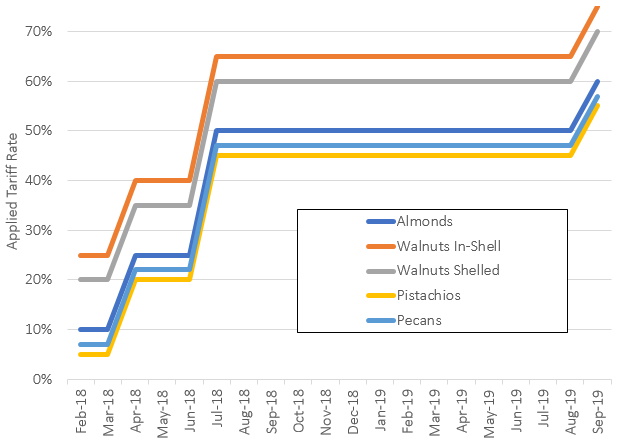
Figure 1 shows the timeline for China’s retaliatory tariff increases on tree nuts. Prior to retaliation, the applied tariff rates were 5% for pistachios, 7% for pecans, 10% for almonds, 20% for shelled walnuts, and 25% for in-shell walnuts. The relatively high applied tariffs for walnuts are related to the fact that China has a large domestic walnut industry that competes with imports. As of November 2019, U.S. tree nuts faced an additional 50% retaliatory tariff compared to other exporters to China. In 2017, prior to the implementation of retaliatory tariffs, China and Hong Kong were the third largest regional export market for U.S. tree nuts (USDA, 2019a, USDA 2019e, USDA 2019f).
Figure 2 shows that applied tariff rates on U.S. tree nut exports to Turkey prior to retaliation were 15% for walnuts and almonds and 43.2% for pistachios. In June 2018, Turkey imposed a 10% retaliatory tariff on U.S. tree nuts, which increased to 20% in August 2018. By May 2019, the tariff was halved (10%). Turkey has been a smaller, but steady, market for U.S. tree nut exports, with exports valued at $308.4 million in 2017 (USDA 2019g, USDA 2018b, USDA 2018c).
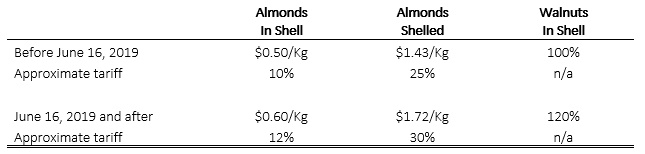
After announcing increases in almond and walnut tariffs in 2018, India did not apply these changes until June 16, 2019 (Table 1), after which India’s walnut tariff rose from 100% to 120%. The tariff change applicable to India’s almond imports is specified in Indian rupees per kilogram (i.e., a specific tariff), which is illustrated in Table 1, converted to U.S. dollars per kilogram using market exchange rates and the approximate ad valorem percentage tariff based on recent export prices of U.S. almonds to India. The specific per kilogram tariff was relatively low initially and rose by 20% for both in-shell and shelled almonds. In ad valorem equivalent terms, the tariff rose from 10% to 12% for in-shell almonds and from 26% to 31% for shelled almonds. India is a growing market for U.S. tree nuts and is currently the second largest single country market (USDA 2019b, USDA 2018a).
In addition to tariffs, governments may use other measure to discourage imports from disfavored sources. For example, much research deals with the differential application of sanitary or phytosanitary measures that limit imports. Other impediments may be less legalistic or transparent. For example, in some countries (such as those with many state-owned firms or regulations that may be enforced differentially) government announcements about trade conflict may be sufficient to reduce imports from less favored sources. Less transparent trade impediments are difficult to quantify but may coincide with retaliatory tariffs. It would be a mistake, however, to attribute all policy-induced changes in trade patterns to changes in tariffs alone.
To assess the likely impacts of retaliatory trade measures on U.S. perennial crop exports, it is instructive to consider four supply/demand and trade characteristics. First, acreage of perennial crops adjusts slowly. Because quantities are difficult to adjust, negative demand shocks may cause large declines in prices of perennial crops.
Second, for many major perennial crops, U.S. exports represent a large share of total world exports. For example, U.S. exports represent between 85% and 90% of world exports of almonds and typically account for 50% or more of world exports of pecans, pistachios, and walnuts (USDA 2019e, USDA 2019f). These high trade shares suggest that U.S. tree nut growers may experience larger market impacts caused by trade shocks.
Third, unlike grains and oilseeds, many relatively small and specialized firms handle the export of tree and vine crop products from the United States. As a result, tree nuts and other perennial crops may face higher costs and delays in reorienting exports to other markets.
Fourth, U.S. tree nut and tree fruit exports may also enter China via re-exports through Hong Kong and Vietnam, which means many of these sales are not captured in official trade data. For example, subtracting official re-exports to China and other countries from exports into Hong Kong leaves implausibly high per capita use if those nuts were to remain in Hong Kong. Similarly, according to USDA’s production, supply, and distribution tables (USDA 2019d), there is very little domestic consumption of almonds, pistachios, and walnuts in Vietnam. For the 2015/2018 marketing years, we find that 30,400, 6,800, 4,600, and 21,500 metric tons of U.S. almonds, pecans, pistachios, and walnuts were exported to Vietnam (USITC Dataweb 2019). These quantities represent about 180% of the almonds, pecans, pistachios, and walnuts combined that were exported officially to China over the same period. The population of Vietnam is only 7% of the population of China, suggesting that per capita imports are inconsistent with consumption in Vietnam. We estimate that about 90% of the tree nuts imported into Vietnam were likely re-exported to China. Thus, for this analysis, we include exports to Hong Kong and Vietnam in total U.S. exports that likely entered China prior to the imposition of retaliatory trade impediments.
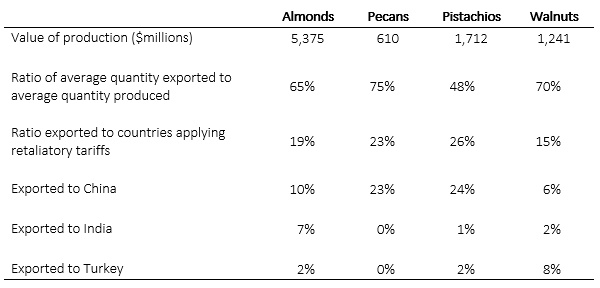
The price impact of trade retaliation for a product depends, in part, on the importance of the affected markets in total demand for that product. Table 2 provides average U.S. tree nut production and export data for 2016/2018 for almonds, pecans, pistachios, and walnuts. Since these are fall-harvested crops, much of the quantity produced in one year is exported in the subsequent calendar year. Therefore, we refer to ratios of exports to production rather than to export share of production. Using a three-year average helps smooth production and export data. Second, harvested area for almonds and pistachios has been expanding rapidly, so average “export shares” are likely to exceed the ratio of exports to production shown in Table 2. Third, certain tree nuts, such as pistachios, experience significant variation in yield (known as alternate bearing), so even a three-year average needs to be interpreted with care. In the case of pistachios, the 2016/2018 period includes a very large crop produced in 2018, most of which had not yet been exported in these data.
For almonds, which have a larger value of production than the other three tree nuts combined, 65% of the crop is exported, on average, and 19% was shipped to the countries that have applied retaliatory tariffs (China, Turkey, India). Exports to China, which has the highest retaliatory tariffs on almonds (see Figure 1), accounted for 10% of U.S. production. Exports to China account for 23% of pecan production, 26% of pistachio production, and 6% of walnut production. For walnuts, exports to Turkey (8% of production) were higher.
Retaliatory tariffs do not occur in isolation. Supply or demand shifts often occur simultaneously, which can make it challenging to sort out impacts. Here, we use an example of recent pistachio market variation to illustrate the effects of the retaliatory trade measures in the context of year-to-year changes in U.S. and foreign pistachio production.
Panel A of Figure 3 represents a stylized version of the market for U.S. pistachios for the 2017/2018 marketing year. This was the period in which the pistachio crop harvested in the fall of 2017 was marketed, mostly before tariff retaliation was underway. D17/18 and D18/19 represent downward-sloping pistachio demand and Q17/18 and Q18/19 represent fixed short-run pistachio supply in the 2017–2018 and 2018/2019 marketing years, respectively. Equilibrium prices in each marketing year are determined by the intersection of demand and supply represented by P17/18 and P18/19. In Panel B, we see that equilibrium prices are compounded not only by the effects of the retaliatory trade measures represented by a leftward shift in demand to D18/19 but also by a larger U.S. crop, represented by a rightward shift in U.S. supply (Q18/19). This suggests that the price of pistachios has fallen even more than would have been the case due to retaliatory tariffs alone.
Finally, Panel C of Figure 3 adds a world market perspective to the U.S. pistachio supply and demand situation. In fall 2018, Iran, the only significant competitor to U.S. pistachios in the world market, experienced an extreme weather shock. The collapse of Iranian pistachio production and exports (Q18/19) led to an increase in export demand for U.S. pistachios, approximately equivalent to the quantity that would have been supplied by Iran in a normal year. Thus, the lack of exports from Iran allowed U.S. exports to expand without a significant collapse in the market price due to retaliatory tariffs.
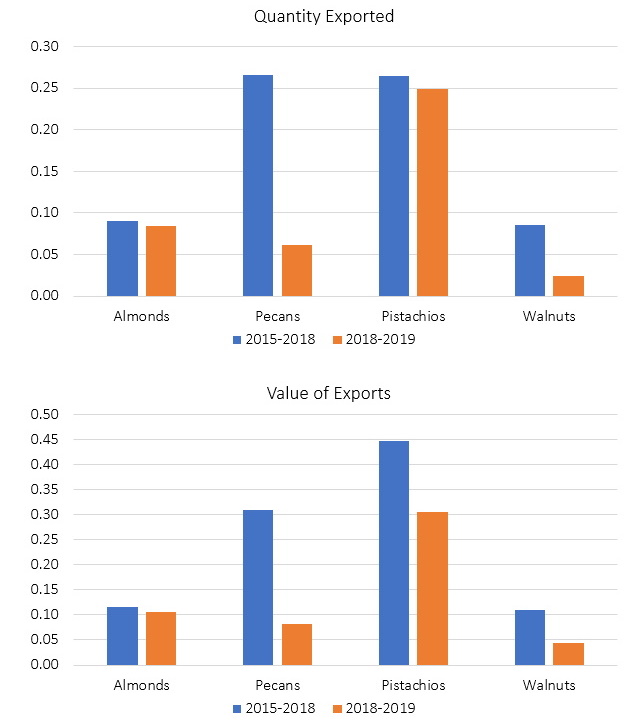
Tree nut acreage has grown significantly in recent decades, and China is a significant market for these products (Table 2). Figure 4 shows that the quantity and value of exports as a share of production to China fell in the marketing year 2018/2019, which was affected by retaliatory tariffs, compared to the base period comprised of average exports as a share of production in marketing years 2014/2015 through 2017/2018.
For almonds, the U.S. share exported to China was only 8% lower by quantity and 10% lower by value in 2018/2019. For pecans, the story is dramatically different, with a collapse in shipments to China from 26% on a quantity basis to 5% and from 30% to 7% on a value basis. The result was an extreme decline in the U.S. export per unit price of pecans. China continued to take a little over 20% of the quantity of U.S. pistachios, but the price premium in China fell substantially such that the share of exports to China by value of production fell from 39% to 26%. For walnuts, the China export share of both quantity and value fell substantially, from 8% to 2% by quantity and from 10% to 4% by value.
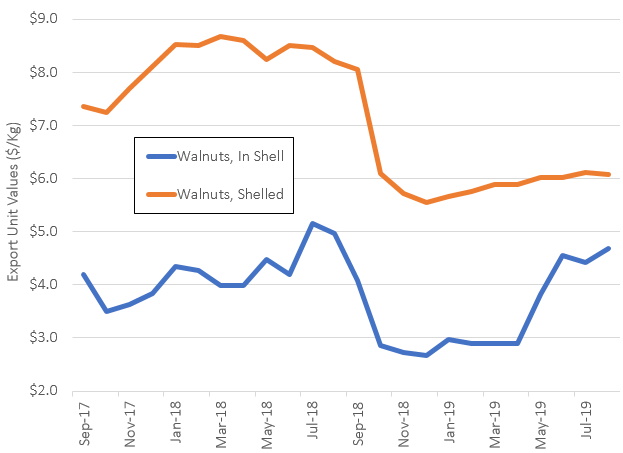
To further illustrate impacts of trade turmoil, Figure 5 examines month-by-month export prices of walnuts to all destinations. Walnuts are sold both in shell and shelled and tariff rates rose for both. Shelled walnuts command a premium price and per unit export prices were above $8/kg through the end of the 2017/2018 marketing year in August 2018. During that period, the per unit export price of in-shell walnuts climbed to reach $5/kg. Then, as new trade barriers were implemented, the per unit export price of walnuts collapsed by more than 40% for both shelled (to $5.50/kg) and in-shell walnuts (to $2.70/kg). Prices of shelled walnuts to all destinations (the higher valued export category) have risen only gradually, while in-shell walnut prices rose rapidly beginning in April 2019. Thus, some of the short-term impacts of trade turmoil for less storable crops, such as shelled walnuts, can be observed in export prices rather than in export quantities.
Recent U.S. tariffs spawned retaliatory trade measures across many products. This article has documented some of the consequences of the resulting trade turmoil for perennial crops, especially tree nuts. These crops are especially export dependent, acreage does not adjust quickly and shifting to new export destinations is costly and slow. Therefore, the industries discussed have faced low market prices relative to what would have occurred.
Regmi, A. 2019. Retaliatory Tariffs and U.S. Agriculture. Washington, DC: Congressional Research Service, Report to Congress R45903.
U.S. Department of Agricultural. 2018a. GOI Notifies Changes in Tariff Structure on Agricultural Imports. Washington, DC: U.S. Department of Agriculture, Foreign Agricultural Service, GAIN Report IN8078, August. Available online: https://apps.fas.usda.gov/newgainapi/api/report/downloadreportbyfilename?filename=GOI%20Notifies%20Changes%20in%20Tariff%20Structure%20on%20Agricultural%20Imports_
New%20Delhi_India_6-22-2018.pdf.
U.S. Department of Agricultural. 2018b. Turkey Introduces New Additional Levy on U.S. Products. Washington, DC: U.S. Department of Agriculture, Foreign Agricultural Service, GAIN Report TR8018, June. Available online: https://apps.fas.usda.gov/newgainapi/api/Report/DownloadReportByFileName?fileName=Turkey%20Introduces%20New%20Additional%20Levy%20on%20U.S.%20Products_Ankara
_Turkey_6-28-2018.
U.S. Department of Agricultural. 2018c. Turkey Announces Second Round of Additional Levies on U.S. Products. Washington, DC: U.S. Department of Agriculture, Foreign Agricultural Service, GAIN Report TR8024, August. Available online: https://apps.fas.usda.gov/newgainapi/api/Report/DownloadReportByFileName?fileName=Turkey%20Announces%20Second%20Round%20of%20Additional%20Levies%20on%20U.S.
%20Products_Ankara_Turkey_8-15-2018.
U.S. Department of Agriculture. 2019a. China - Peoples Republic of - Tree Nuts Annual: U.S. Tree Nuts to Lose Market Share in China Due to Additional Tariffs. Washington, DC: U.S. Department of Agriculture, Foreign Agricultural Service, GAIN Report CH19061, September. Available online: https://www.fas.usda.gov/data/china-tree-nuts-annual-3.
U.S. Department of Agricultural. 2019b. GOI Raise Tariffs on U.S. Ag Products from June 16. Washington, DC: U.S. Department of Agriculture, Foreign Agricultural Service, GAIN Report released June 17, 2019. Available online: https://apps.fas.usda.gov/newgainapi/api/Report/DownloadReportByFileName?fileName=GOI%20Raise%20Tariffs%20on%20Specific%20U.S.%20Ag%20Products%20from%20June%2016_
New%20Delhi_India_6-17-2019.
U.S. Department of Agriculture. 2019c. Growing Markets for U.S. Agricultural Exports: Vietnam, Thailand, and Burma. Washington, DC: U.S. Department of Agriculture, Foreign Agricultural Service, International Agricultural Trade Report, October. Available online:
https://www.fas.usda.gov/data/growing-markets-us-agricultural-exports-vietnam-thailand-and-burma.
U.S. Department of Agriculture. 2019d. Production, Supply and Distribution Online Tables. Washington, DC: U.S. Department of Agriculture, Foreign Agricultural Service. Available online: https://apps.fas.usda.gov/psdonline/app/index.html [Accessed October 2019].
U.S. Department of Agriculture. 2019e. Tree Nuts: World Markets and Trade. Washington, DC: U.S. Department of Agriculture, Foreign Agricultural Service, February. Available online: https://www.fas.usda.gov/data/tree-nuts-world-markets-and-trade.
U.S. Department of Agriculture. 2019f. Tree Nuts: World Markets and Trade. Washington, DC: U.S. Department of Agriculture, Foreign Agricultural Service, October. Available online: https://www.fas.usda.gov/data/tree-nuts-world-markets-and-trade.
U.S. Department of Agricultural. 2019g. Turkey Reduces the Additional Levies on US Products. Washington, DC: U.S. Department of Agriculture, Foreign Agricultural Service, GAIN Report TR9012, August. Available online: https://apps.fas.usda.gov/newgainapi/api/report/downloadreportbyfilename?filename=Turkey%20Reduces%20the%20Additional%20Levies%20on%20US%20Products_Ankara_Turkey
_5-22-2019.pdf.
U.S. Department of Agriculture. 2019h. Global Agricultural Trade System (GATS). Washington, DC: U.S. Department of Agriculture, Foreign Agricultural Service. Available online: https://apps.fas.usda.gov/gats/default.aspx [Accessed October 2019].

