International trade provides an important source of economic well-being. The free movement of goods across international borders allows producers to scale their operations, specialize in the production of lower cost goods for both domestic and foreign markets, and provides consumers with access to a greater variety of products throughout the year. The World Trade Organization (WTO) and its predecessor, the General Agreement on Tariffs and Trade (1947), were set up to promote the movement of goods across international borders and discourage the use of protectionist policies set unilaterally by individual countries.
Since the turn of the century, however, the global trading system has suffered its deepest impasse in modern history (Bown and Irwin, 2018; Baldwin, 2016; Grant and Boys, 2012). In 2018, U.S. agricultural exports to some of its largest and most significant trading partners—including China, Canada, Mexico, the EU, Turkey, and most recently, India—were hit with retaliatory tariffs (Crowley, 2019; Bown, 2018; Bown, 2019; Amiti, Redding, and Weinstein, 2019). While much has been written about the coverage and scope of retaliatory tariffs against U.S. agriculture (Regmi, 2019; Marchant and Wang, 2018), a one-year ex post empirical evaluation of actual trade impacts has received less attention.
We evaluate the impacts of retaliatory tariffs on U.S. agricultural exports, given that we now have one full year of monthly bilateral trade data at the product line from which to conduct an ex post assessment. Specifically, we model U.S. bilateral export flows for most products hit by retaliatory tariffs to retaliating and nonretaliating markets in the years preceding and during the trade dispute. We provide a comprehensive first look at how retaliatory tariffs on agricultural product exports have altered major commodity exports to destination markets—including China, the EU, Mexico, Canada and Turkey—as well as potential export expansion in nontraditional markets. An ex post understanding of actual trade impacts in partner markets is important for agricultural policy makers, producers, consumers, and agribusiness stakeholders.

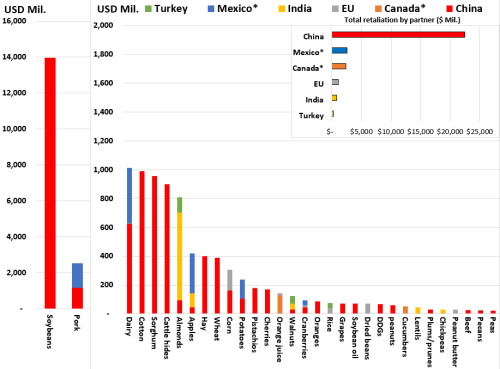
Notes:*Tariffs lifted May 19, 2019.
Source: Authors’ calculations.
In total, over 800 U.S. agricultural exports worth nearly $30 billion in 2017—including grains, livestock, dairy, horticulture, specialty crops, processed foods, beverages, tobacco and cotton—were hit by retaliatory tariffs in China, Canada, Mexico, the EU, Turkey, and most recently, India (June 2019). Figure 1 plots the 2017 value of U.S. agricultural exports subject to tariff retaliation in 2018/2019. To ease exposition, we focus on 32 U.S. export product groupings with nonzero exports to China, Canada, Mexico, the EU, Turkey and India, and omit a number of other important food categories including alcohol (i.e., whiskey), jams/jellies, ketchup, pizzas, tobacco, fruit juices, breakfast cereals. U.S. exports of soybeans and pork are listed on a separate scale due to their large export values.
Several results are worth emphasizing. First, the significance of China’s tariff actions (shown in red) is evident and accounts for nearly 80% of total retaliatory tariffs against U.S. agricultural exports to these six countries. Second, China’s retaliatory trade actions comprise a significant share of the top eight categories for which U.S. export values exceed $500 million in 2017—soybeans, pork, dairy, cotton, sorghum, almonds, hides/cattle, and apples. The exception is China’s retaliation against almonds, for which U.S. exports to India are larger. India’s retaliatory tariffs on tree nuts, pulses, and apples were delayed throughout 2018 and imposed in June 2019. For this reason, we do not include India in the empirical analysis. Third, among the top eight categories of U.S. agricultural exports, China is the only country that imposed duties on soybeans, cotton, sorghum, and cattle hides. Fourth, Mexico’s retaliation was concentrated in pork (hams and shoulders), dairy (cheese), apples, potatoes, and relatively small amounts of U.S. cranberry exports. Finally, tariff retaliation by Canada and the EU are also concentrated among a few products including corn (EU), cranberries (EU), orange juice (EU and Canada), dried beans (EU), cucumbers (Canada), peanut butter (EU), and pecans (EU).
Up until now, ex post assessment of the impacts of trade retaliation against U.S. agricultural exports have largely relied on descriptive trends in trade-flow data (Regmi, 2019). Such analyses examine the simple change, or “delta,” of U.S. agricultural exports before and after the imposition of retaliatory tariffs. For example, U.S. soybean exports to China were $11.2 billion from July 2017 to June 2018, before falling 72%, to $3.1 billion between July 2018 to July 2019, when retaliatory tariffs were in place. Analogously, total agricultural exports from the United States to China fell by $10.7 billion, or 58% over the same period.
However, before and after comparisons do not account for confounding factors in addition to retaliatory tariffs. For example, in the 2018/2019 marketing year, excellent weather conditions led to a record soybean harvest in the United States—over 4.5 billion bushels (see Hitchner, Menzie, and Meyers in this issue of Choices). All else equal, a harvested supply of this magnitude would result in larger-than-expected levels of U.S. soybean exports to China. In these situations, before and after comparisons are likely to underestimate the impact of tariffs. Similarly, other confounding supply and demand shocks pervaded throughout the 2018/2019 trade conflict—African Swine Fever in China (ASF) (Nti, Kuberka, and Jones in this issue of Choices), record supplies of U.S. livestock production, and exceptionally poor U.S. planting conditions in Spring 2019—which collectively challenge identification of the causal impact of retaliatory tariffs.
We conduct a one-year, ex post econometric evaluation of the impact of 2018/2019 retaliatory tariffs on U.S. agricultural exports, including the direct effects of retaliatory tariffs and the indirect effects on U.S. agricultural exports to alternative markets and competing suppliers’ trade patterns. The methodology employs a monthly gravity model (see Head and Mayer, 2014; Grant and Boys, 2012) of bilateral trade flows designed to isolate the effects of tariff retaliation. By exploiting bilateral variation in trade patterns across exporting and importing countries before and after the imposition of retaliatory duties and including other variables to control for supply and demand shocks as well as seasonality and product-level effects, we provide an initial assessment and ranking of the change in export values that can be attributed to retaliatory tariff measures.
Bilateral trade data are sourced from the Global Trade Atlas database (2019) which provides monthly bilateral trade values at the 6-digit level of the Harmonized System (HS) of product codes from January 2016 through to July 2019. The model includes HS 6-digit products in which U.S. exports totaled $50 million or more to the global marketplace in the 2016/2017 period preceding the trade dispute. 224 export products facing retaliation by China, the EU, Canada, Mexico, and Turkey are included. Tariff retaliation by India that occurred later in 2019 is omitted from the analysis. Agricultural goods include beef, pork, dairy, poultry and eggs, fruits, vegetables and tree nuts, cereals and cereal preparations, oilseeds, and a number of processed meat, food, alcoholic beverages, and byproduct (e.g., distiller dried grains (DDG), soybean meal and oil, corn syrup) categories.
We provide several ex post trade impact results estimated using the econometric gravity model.

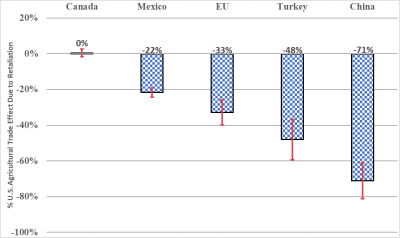
Source: Authors’ calculations from econometric model.
Figure 2 presents a ranking of model estimated U.S. agricultural trade impacts (percentage trade effect) for each country imposing retaliatory tariffs in 2018/2019. Plotted are the model estimated percentage trade flow changes in U.S. product-line exports in the months in which U.S. agricultural exports faced retaliation by China, Mexico, Canada, the EU, and Turkey compared to the same months and product lines in 2016/2017, when these products were not subject to retaliation. Also shown are the upper- and lower-bound 95% confidence intervals.
Retaliatory tariffs imposed by China have resulted in the largest decline in U.S. agricultural product exports. On a monthly product-by-product basis, U.S. agricultural exports subject to China’s retaliatory tariffs were down by 71% on average, compared to the same product–month periods in the 2016/2017 benchmark. Importantly, this result is significantly higher than a simple before-and-after comparison of trade flows. According to U.S. census data (see USDA, 2019), over the same time frame examined by the model, U.S. agricultural exports to China fell from $18.5 billion (July 2017–June 2018) to $7.8 billion (July 2018–June 2018)—a 58% decline in export value. The model-based findings, which control for other factors discussed previously, estimates what trade “should be” in the absence of retaliatory tariffs and identifies a much higher trade impact.
U.S. agricultural exports facing retaliation in Turkey and the EU ranked second and third, respectively, among retaliatory destination markets where U.S. agricultural exports suffered losses. Retaliation by Turkey and the EU reduced U.S. monthly product-line trade flows by an average of −48% and −33%, respectively. Export losses in Turkey and the EU, however, are roughly half those experienced in China. Finally, the impact of retaliatory tariffs by Mexico resulted in a 22% decrease in U.S. agricultural exports for those products subject to retaliation; interestingly, the impacts of Canadian retaliatory tariffs were statistically insignificant and not distinguishable from zero. The insignificant trade effect in Canada is likely due to the significantly integrated U.S. and Canadian agricultural market, the nature of products subject to retaliation in Canada (i.e., differentiated processed food categories), and the relatively smaller 10% retaliatory tariffs applied by Canada.

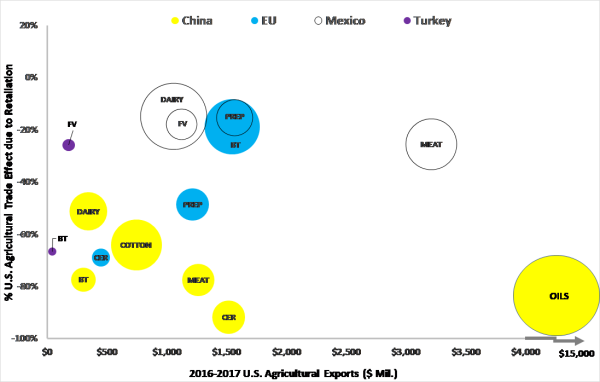
Notes: FV: Fruit and Vegetables, BT: Beverage and Tobacco, OILS: Oilseeds, Cotton, Dairy,
MEAT: Meat and animal products, SGR: Sugar and candy products, CER: Cereals,
PREP: Prepared and processed food including fruit and vegetable preparations.
The area of the bubble is proportional to the country's share in U.S. exports for the sector in 2016/2017.
For example, Mexico accounts for 20% of U.S.MEAT exports whereas China accounts for nearly
60% of U.S. OILS exports.
Figure 3 illustrates U.S. agricultural trade impacts at the sector level by graphing the percentage trade effect estimated by the model on the vertical axis and the average 2016/2017 value of U.S. sector-level exports preceding the trade conflict. The size of the bubble denotes the share of China, EU, Mexico, and Turkey imports sourced from the United States. Statistically significant results (i.e., bubbles) are reported. To ease exposition, nine agricultural sector groupings are included: (i) fruits, vegetables, and tree nuts (FV); (ii) beverages and tobacco (BT); (iii) oilseeds (OILS); (iv) cotton (COT); (v) dairy products (DAIR); (vi) animal products (MEAT); (vii) sugar and confectionary candy products (SGR); (viii) cereals and preparations (CER); and (ix) prepared and mixed processed foods, including fruit and vegetable preparations (PREP).
Several results emerge. First, cereals, meat, oilseeds, beverages and tobacco, cotton, and dairy product exports to China and cereal exports to the EU are the destination–product combinations with a greater than 50% reduction in U.S. agricultural exports during the months in which retaliatory tariffs were imposed. Second, seven out of nine sectors affected by retaliatory duties in China show negative trade flow effects, six of which are greater than 50% (DAIR, COT, BT, MEAT, CER, OILS). EU tariff actions had a noticeable impact on U.S. cereal (CER) and prepared foods (PREP) exports with reductions in U.S. exports of 69% and 50%, respectively. Note, however, that the share of U.S. exports of cereal and food preparations to the EU, as represented by the diameter of the bubbles, is relatively small, at 2% and 8%, respectively. Conversely, while the impact of EU retaliatory tariffs on U.S. beverages and tobacco (BT) exports is smaller (−20%) the relatively larger size of the BT bubble indicates the EU is a more important destination market for the U.S. exports in this product category (i.e., bourbon and other whiskey). Indeed, U.S. exports of BT products account for 23% of EU imports in this sector.
Third, retaliatory tariffs imposed by Turkey led to trade declines of 26% and 67% on U.S. exports of FV and BT products, respectively. U.S. export losses to Turkey in the BT sector are likely the result of very high retaliatory duties on certain alcoholic beverages. Turkey’s additional tariffs range from 10% on tree nuts, 25% on rice, to 70% on certain alcoholic beverages including bourbon, vodka, and gin.
Fourth, within North America, Mexico’s retaliatory tariffs impacted U.S. agricultural exports to a greater extent than was found in Canada. In particular, Mexican duties on U.S. pork and processed meats (MEAT) and dairy (DAIR) (particularly cheese) resulted in U.S.–Mexico trade flow reductions of 26% and 15%, respectively. Moreover, the relatively larger bubbles for dairy and meat exports to Mexico illustrate the importance of these two categories, where U.S. exports account for 20% and 34% of Mexico’s total imports, respectively. As noted earlier, most U.S. agricultural exports to Canada were not statistically significant in the model. Canada’s 10% retaliatory duties covered 41 U.S. agricultural product lines, including yogurt, coffee, cucumbers, and pizza.
Fifth, Figure 3 highlights the importance of U.S. oilseed exports to China. This product category is the only sector located in the lower right quadrant of Figure 3, indicating

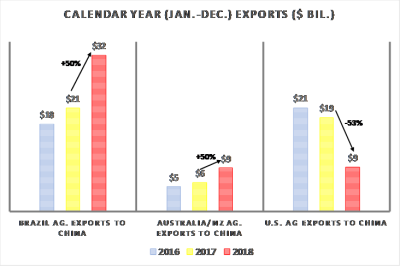
Notes: Agricultural export totals by Brazil and Australia/New
Zealand (NZ) to China reflect 224 product lines included in our
sample of monthly trade data. U.S. agricultural export totals reflect
U.S. Census data (https://apps.fas.usda.gov/gats/default.aspx).
Finally, an additional consequence of the 2018/2019 trade dispute is the potential reorientation of trade to alternative markets. Figure 4 illustrates the extent to which competing suppliers “picked up the slack” by plotting the value of agricultural exports by Brazil and Australia/New Zealand to China alongside U.S. agricultural exports to China. Both Brazil and Australia/New Zealand, which compete with U.S. exports in several product categories, experienced a 50% increase in their agricultural exports to China in 2018. Brazil’s agricultural exports increased from $21 billion in 2017 to $32 billion in 2018 and Australia/New Zealand agricultural exports increased from $6 billion in 2017 to $9 billion in 2018. These countries were the largest beneficiaries of the U.S.–China trade dispute (other exporters experiencing trade flow gains in China include Argentina, Canada, and Mexico).
Second, an important question mark amid the U.S.–China trade dispute is whether U.S. agricultural exports were also able to find alternative destination markets. For example, despite several product sectors that experienced significant declines (Figure 3) due to retaliatory tariffs by the EU, overall U.S. agricultural exports to the EU were up by nearly $2.0 billion. U.S. agricultural exports were also up in certain product categories to South America and several other rest of world regions. This assessment does not address whether trade diversion to alternative markets compensated for losses experienced in China, Turkey, the EU, and Mexico. We leave this for further research, although preliminary analyses suggest that this is likely not the case (see Regmi, 2019).
Trade disruptions due to tariff retaliation in 2018–2019 had a significant impact on U.S. agricultural exports. Over $30 billion in retaliatory tariffs was imposed on U.S. grains, livestock, dairy, horticulture, specialty crops, and other agricultural and food exports. Recent USDA estimates project $11 billion in agricultural exports to China for fiscal year 2020, half of the $21.8 billion in fiscal year 2017 exports.
Using a model of monthly bilateral trade flows to tariff imposing and non-imposing markets over the January 2016 through July 2019 period, this study found that U.S. agricultural exports subject to retaliation experienced a 71% decline in the Chinese market, on average. Significant declines in U.S. agricultural exports were also experienced in Turkey (−48%), the EU (−33%), and Mexico (−22%). Seven product sectors comprising U.S. agricultural exports hit by retaliatory tariffs experienced trade declines in China and in six of these sectors, trade reductions exceeded 50%.
The share of China in total U.S. agricultural exports peaked at 18% in 2012, gradually declined to 14% in 2017, and then fell precipitously to just 6.6% in 2018 when U.S. exports were subject to retaliation. While erosion of the share of U.S. agricultural exports to China since 2012 has other causes and may have continued in the absence of retaliation (Hejazi et al., 2019; Ning and Grant, 2019; Grant et al., 2019), our results suggest that China’s use of retaliatory tariffs in 2018/2019 significantly contributed to this decline. Whether U.S. agricultural exports can regain their leading position in China remains to be seen and is likely to be the subject of a significant amount of future research.
Amiti, M., S. J. Redding, and D. Weinstein. 2019. “The Impact of the 2018 Trade War on US Prices and Welfare.” Journal of Economics Perspectives, 33(4): 187-210
Baldwin, R. 2016.”The World Trade Organization and the Future of Multilateralism.” Journal of Economic Perspectives 30(1): 95–116.
Bown, C.P. 2018, April 19. “Trump’s Trade War Timeline: An Up-to-Date Guide [blog post].” Trade and Investment Policy Watch, Peterson Institute for International Economics. Available online: https://www.piie.com/blogs/trade-investment-policy-watch/trump-trade-war-china-date-guide
Bown, C.P. 2019, September 20. “US-China Trade War: The Guns of August [blog post].” Trade and Investment Policy Watch, Peterson Institute for International Economics. Available online: https://www.piie.com/blogs/trade-and-investment-policy-watch/us-china-trade-war-guns-august
Bown, C.P., and D. Irwin. 2018. “What Might a Trump Withdrawal from the World Trade Organization Mean for US Tariffs?” Washington, DC: Peterson Institute for International Economics, Policy Brief PB18-23.
Crowley, M. A. 2019. “Trade War: The Clash of Economic Systems Threatening Global Prosperity.” London, UK: Centre for Economic Policy Research (CEPR) Press.
Gale, F., C. Valdes, and M. Ash. 2019. “Interdependence of China, United States, and Brazil in Soybean Trade” Washington, DC: U.S. Department of Agriculture, Economic Research Service, Outlook Report OCS-19F-01, June.
Global Trade Atlas. 2019. HIS Markit. Available online: https://www.gtis.com/gta/ [Accessed September 30, 2019].
Grant, J. H., and K. A. Boys. 2012. “Agricultural Trade and the GATT/WTO: Does Membership Make a Difference?” American Journal of Agricultural Economics 94(1): 1–24.
Grant, J. H., S. Arita, X. Xie, and C. Emlinger. 2019. “Global Agri-Food Trade Shocks: A Historical Econometric Assessment.” Paper presented at the annual meeting of the American Agricultural and Applied Economics Association, Atlanta, GA, July 21–23.
Head, K., and T. Mayer. 2014. “Gravity Equations: Workhorse, Toolkit, and Cookbook.” In G. Gopinath, E. Helpman, and K. Rogoff (eds.), Handbook of International Economics, vol. 4. Kidlington, UK: Elsevier, 131–195.
Hejazi, M., M.A. Marchant, J. Zhu, and X. Ning. 2019. “The Decline of U.S. Export Competitiveness in the Chinese Meat Import Market.” Agribusiness: An International Journal 35(1): 114–126.
Marchant, M. A., and H. H. Wang. 2018. “Theme Overview: U.S.–China Trade Dispute and Potential Impacts on Agriculture.” Choices 33(2): 1–3.
Ning, X., and J. H. Grant. 2019. “New Estimates of the Ad-Valorem Equivalent of SPS Measures: Evidence for Selected Case-Studies and Specific Trade Concerns.” Blacksburg, VA: Virginia Tech, College of Agriculture and Life Sciences, Center for Agricultural Trade Research, Report No. CAT-2019-10.
Regmi, A. 2019. “Retaliatory Tariffs and U.S. Agriculture.” Washington, DC: Congressional Research Service, Report to Congress R45903, September.
U.S. Department of Agriculture. 2019. Global Agricultural Trade System (GATS). Washington, DC: U.S. Department of Agriculture, Foreign Agricultural Service. Available online: https://apps.fas.usda.gov/Gats/default.aspx [Accessed November 20, 2019].