| 1986-1995 | 1996-2005 | 2006-2016 | ||||
| Average per year | 2016 | 2017 | 2018 | |||
| Wild-capture fisheries | ||||||
| Inland | 7.1 | 9.1 | 11.7 | 12.6 | 13.1 | 13.2 |
| Marine | 88.7 | 91.5 | 87.4 | 86.3 | 89.5 | 93.0 |
| Total capture fisheries | 95.8 | 100.6 | 99.1 | 98.9 | 102.6 | 106.3 |
| Aquaculture | ||||||
| Inland | 9.5 | 21.8 | 40.6 | 52.9 | 54.7 | 56.5 |
| Marine | 6.9 | 15.9 | 25.1 | 31.4 | 33.1 | 34.0 |
| Total aquaculture | 16.4 | 37.7 | 65.7 | 84.3 | 87.7 | 90.5 |
| Total world production | 112.2 | 138.3 | 164.8 | 183.2 | 190.4 | 196.8 |
Source: FAO (2020).
Global seafood supply significantly increased from the late twentieth century, with aquaculture becoming an important source of seafood, supplementing supplies from wild-capture fisheries. Recent estimates from the United Nations (UN) Food and Agriculture Organization (FAO) indicate that global fish production in 2018 was about 197 million tons, compared to an average global annual fish production of 112 million tons from 1986 through 1995 (FAO, 2020) (Table 1).
In 2018, seafood supply from aquaculture (90.5 million tons) accounted for 46% of total global supply, compared to the 15% contribution of aquaculture to global seafood supply from 1986 to 1995. About 172 million tons, representing 87% of total global fish, was consumed as food, with supply from aquaculture production contributing 52%, a trend expected to continue because of advancements in fish-farming technology (Kumar and Engle, 2016; FAO, 2020). Aquaculture is on track to be the main supplier of seafood for human consumption by 2030 (Kobayashi et al., 2015). Seafood produced for human consumption includes finfish, crustaceans, mollusks, and other edible aquatic plants and animals.
The main drivers of aquaculture growth from the supply side are improved fish genetics and hatchery technology, enhanced feed nutrition and disease management, labor-saving technology and intensification, and efficient technology diffusion (Kumar and Engle, 2016). Another contributing factor is sustainability challenges with respect to increasing depletion of wild fish stocks. China, the dominant global fish-producing nation, supplied 35% of 2018 global seafood, far more than total fish production in any other regions of the world. For example, in 2018, supplies from Asia (excluding China) made up 34% of global production; the Americas, 14%; Europe, 10%; Africa, 7%; and Oceania, 1% (FAO, 2020).
Though Asia dominates global seafood production, the United States is a major source of supplies from capture fisheries, accounting for 5% of global capture fisheries; the United States ranks sixth in global capture fisheries production (FAO, 2020). U.S. seafood production from aquaculture is minimal compared to the rest of the world and has remained relatively stable for about two decades. USDA (2020) census data indicate total farm sales from U.S. aquaculture of $1.09 billion in 2005, $1.37 billion in 2013, and $1.51 billion in 2018. Total U.S. seafood production for human consumption in 2019 is estimated to be about 4.1; 3.8 million tons from capture fisheries (93% of production) and 0.3 million tons from aquaculture (7% of production) (NOAA, 2021; USDA, 2020).
| Rank | Species | Per Capita (lb) | % Market Share |
| 1 | Shrimp | 4.70 | 24% |
| 2 | Salmon | 3.10 | 16% |
| 3 | Canned tuna | 2.20 | 11% |
| 4 | Alaska pollock | 0.996 | 5% |
| 5 | Tilapia | 0.98 | 5% |
| 6 | Cod | 0.59 | 3% |
| 7 | Catfish | 0.55 | 3% |
| 8 | Crab | 0.52 | 3% |
| 9 | Pangasius | 0.36 | 2% |
| 10 | Clams | 0.30 | 2% |
| Total Top 10 | 14.28 | 74% | |
| all other species consumption | 4.92 | 26% | |
| per capita consumption | 19.20 | 100% |
Source: NFI (2021)
Global per capita fish consumption in 2018 was 45.2 pounds (FAO, 2020). Of the various forms of seafood used for direct human consumption, live, fresh or chilled fish accounted for 44% of products; frozen seafood, 35%; prepared and preserved fish, 11%; and cured 10% (FAO, 2020). Estimated U.S. per capita seafood consumption in 2019 was 19.2 pounds, of which 15.0 pounds was fresh and frozen seafood (9.0 pounds of finfish and 6.0 pounds of shellfish), 3.9 pounds was canned seafood products, and 0.3 pounds was cured fish (NOAA, 2021). In 2019, consumption experienced a slight increase over 2018 to 19.0 pounds, a 1.05% increase attributed to a small increase in canned seafood consumption (NOAA, 2021). A few seafood species dominate the international market—notably shrimp, salmon, tilapia, catfish, and pangasius—most of which are supplied by aquaculture. In the United States, the top ten seafood products consumed (in decreasing order) are shrimp, salmon, canned tuna, Alaska pollock, tilapia, cod, catfish, crab, pangasius, and clams; these ten species account for 74% of total seafood consumed in the United States (NFI, 2021) (Table 2).
Globally, increasing global population trends and demand for animal protein has led to an increase in seafood consumption. However, consumption levels vary by nation and region. For example, seafood is traditional component of diets in Southeast Asian countries, which remain among the top seafood-consuming regions worldwide. In 2018, about 71% of total global seafood supply was consumed in Asia (excluding Japan); the United States, European Union, and Japan consumed 19%; and other regions accounted for the remaining 10% (FAO, 2020). The U.S. and E.U. markets are target destinations for many exporting nations (Tveteras, 2015; Engle, Quagrainie, and Dey, 2017).
Because U.S. domestic production is insufficient to meet demand, the United States continues to be a major seafood importer in terms of both value and quantity. Federal agencies and industry groups estimate that the United States imports anywhere from 70% to 85% of seafood to meet domestic demand. In 2019, the United States imported 6.0 million tons of edible seafood, with over half produced from aquaculture; by accounting for domestic production and export, total seafood supply available for human consumption was 12.8 million tons (NOAA, 2021).
Increasing global seafood demand is a result of availability, rising disposable incomes, urbanization, price competitiveness with other proteins, and health and nutrition attributes of fish (Alfnes, Chen, and Rickertsen, 2018; Asche et al., 2015; FAO, 2020; Shamshak et al., 2019). Improvements in seafood supply chain and logistics as well as bilateral and regional trade agreements have also supported increased seafood availability at relatively lower costs. Consequently, seafood markets are no longer considered local markets but rather international markets with trade implications (Anderson, Asche, and Garlock, 2018; Asche et al., 2015; Shamshak et al., 2019).
Salmon and shrimp are the most globally traded seafood in terms of value, and these are predominantly sourced from aquaculture (FAO, 2020). In 2018, salmon—mostly Atlantic salmon—accounted for about 19% of the total value of international seafood trade, while shrimp and prawns accounted for about 15%. About 61% of total global shrimp supply and 78% of salmonids come from aquaculture (NOAA, 2020). In 2019, the United States imported 1.5 billion pounds of shrimp, valued at $6.0 billion and representing 27% of total edible import value, and about 886.4 million pounds of salmon, valued at $4 billion (NOAA, 2021).
The globalization and competitive nature of seafood markets have resulted in diverse programs by various entities. Governments, nongovernment organizations (NGOs), associations, major seafood buyers, and other stakeholders have established regulations, standardization, and certification programs associated with environmental sustainability and conservation, water quality, animal welfare, production methods, labor standards, origin, food safety, traceability, and labeling as well as other informational programs (Prag, Lyon, and Russillo, 2016; Alfnes, Chen, and Rickertsen, 2018). While some regulations and informational programs have existed for years, others were developed more recently, and the number of these continues to increase. Many of the programs are transnational and have been largely developed in response to consumer attitudes and preferences and health, safety, and environmental concerns. The goals for these programs are to assure environmental and social responsibility, safety and quality standards, and consumer confidence in seafood (Alfnes, 2017; Del Giudice et al., 2018). Major seafood buyers may also use the programs for product differentiation (Alfnes, 2017).
While some of the information programs may be mandatory, they may also apply to either wild-capture fisheries, aquaculture, or both and can vary from region to region. The programs come in various forms, including internationally accepted protocols, national government requirements and certifications, third-party certifications, and private labeling schemes (Alfnes, Chen, and Rickertsen, 2018; Del Giudice et al., 2018). Alfnes, Chen, and Rickertsen (2018) present an extensive review of different labeling schemes pertaining to aquaculture; below are the main highlights of certifications and general informational labeling programs being adopted in the seafood marketplace.
Sustainability in capture fisheries is aimed at minimizing overfishing of important species; protecting habitat ecosystems; and decreasing harvest of nontarget species and bycatch. sustainability in aquaculture is based on ecological, environmental, and social responsibility and fish production practices (Prag, Lyon, and Russillo, 2016; Alfnes, 2017; Engle, Quagrainie, and Dey, 2017). Sustainability garners the most attention with regard to seafood and has attracted various standards, certification, and verification programs. Concern for sustainability in capture fisheries has persisted for decades with labels like “dolphin safe” tuna, which is an international trade label requirement (UNCLOS, 1982).
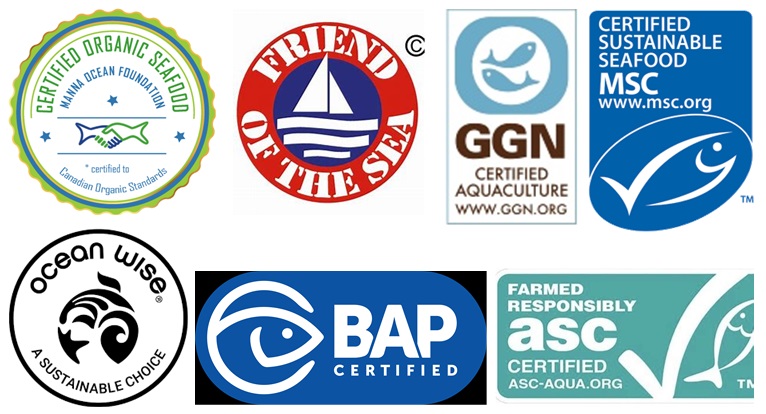
The number of third-party certifications and corporate verifications of more broad-based sustainability objectives focused on multiple issues has increased in recent years. Organizations like the Marine Stewardship Council (MSC) (www.msc.org), Friend of the Sea (www.friendofthesea.org), the Aquaculture Stewardship Council (ASC) (www.asc-aqua.org), Best Aquaculture Practices (www.bapcertification.org), and Global G.A.P. (www.globalgap.org) have developed sustainability standards and a producer implementing them can use the respective certification labels for marketing purposes (Figure 1). Major seafood retailers in the United States and European Union have adopted these certification programs.
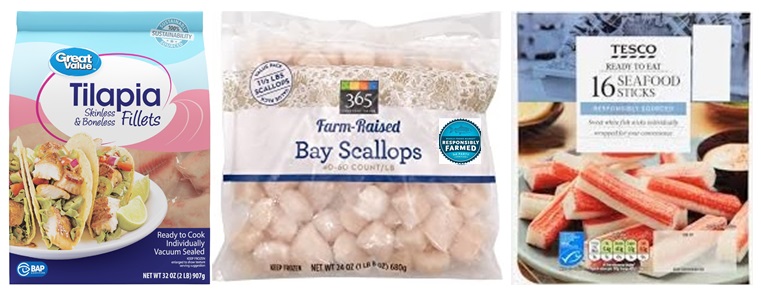
High-volume seafood buyers and large retailers in developed countries also have sustainability requirements in sourcing seafood as part of their corporate social and environmental responsibility programs (Alfnes, 2017). Major food retailers such as Walmart, Whole Foods, and TESCO maintain private labels for sourcing sustainable seafood (Figure 2).
NGOs such as Naturland, the Soil Association, and the International Federation of Organic Agriculture Movements (IFOAM) began organic certification decades ago following their organic production principles in traditional agriculture. Various nations—including Canada and the European Union—also developed their standards with guidelines and requirements on genetically modified organisms (GMO) in aquaculture; use of antibiotics, hormones and synthetic additives; stocking densities; feeding; water quality; and fish handling (Canadian General Standard Board , 2018; European Union, 2021a). Requirements can be quite specific for some species. For example, the EU guidelines lay out some specific requirements for salmon and seaweed relating to production.
The United States currently does not have aquaculture standards though the USDA’s National Organic Program (NOP) constituted a working group that developed organic aquaculture standards for U.S. aquaculture in 2016. A proposed final rule reviewed by the Office of Management in Budget (OMB) has yet to be published in the Federal Register for public comments. Meanwhile, because the United States is a target market for seafood exporters in other nations, certified organic seafood products in the U.S. market use various international organic aquaculture standards from NGOs, other nations, and private initiatives. “Organic” labeled seafood in the U.S. market is estimated to account for 0.5%–1% (Orlowski, 2017). In general, organic products attract higher premiums than conventional aquaculture products; they remain a niche market (Orlowski, 2017; Ankamah-Yeboah et al., 2019).
In 2015, the U.S. Food and Drug Administration (FDA) approved a genetically modified Atlantic salmon from AquaBounty Technologies (aquabounty.com/about-us) for human consumption. A limited quantity of the salmon is available in the Canadian market and began appearing in the U.S. market in 2021 (AquaBounty Technologies, Inc., 2021). It is worth noting that there is no mandatory requirement for AquaBounty’s salmon to be labeled “genetically modified.”
Besides certifications, various government agencies, and industry and advocacy groups on seafood have released guides and advisories. In the United States, while government agencies provide recommendations on seafood consumption based on human health and risks benchmarks, NGOs have program guides based on the sustainability of seafood sources. In the United States, the FDA, the Environmental Protection Agency (EPA), the Department of Health and Human Services (DHHS), the USDA, and various state governments have published advisories on seafood that consumers should avoid due to risks to human health and recommendations for seafood dietary intake for health benefits.
NGOs provide guides to inform consumers about sustainability issues with a goal of promoting sustainability of fisheries and aquaculture in seafood consumption decisions. Some common guides are from the Monterey Bay Aquarium Seafood Watch program (www.seafoodwatch.org/recommendations/download-consumer-guides), World Wildlife Fund’s Seafood Guide (wwf.panda.org/act/live_green/out_shopping/seafood_guides/), Environmental Defense Fund’s Seafood Selector (seafood.edf.org/), Fish Choice (fishchoice.com/), and Environmental Working Group’s Consumer Guide to Seafood (www.ewg.org/consumer-guides/ewgs-consumer-guide-seafood).
A unique quality of seafood is the number and diversity of species with different common and scientific names. To ensure consistency and use of commonly acceptable names, the FDA (2021) has released a list of acceptable market names for seafood that should be used for labeling the species. EU labeling requirements for retail sale of seafood include information on the commercial designation as well as the scientific names of the species; individual EU countries also have respective national lists of accepted commercial designations (European Union, 2013). These labeling requirements are also meant for transparency—especially for processed seafood—to avoid product substitutions and mislabeling.
An emerging dimension of species naming relates to seafood developed from cell culture technology. The cellular technology involves the potential for producing seafood from fish cell and tissue cultures utilizing biomedical engineering with aquaculture techniques (Rubio et al., 2019). The FDA (2020) sought comments and information on the technology in the Federal Register to guide labeling requirements for such products.
As noted earlier, seafood supply from aquaculture production accounted for 52% of total seafood consumed as food in 2018, with some major species—such as shrimp, salmon, tilapia, catfish, and carp—predominantly farmed. These seafood species are commonly available to consumers in the marketplace and may not be totally different from wild-captured seafood, though there are mandatory requirements for providing information on production method (European Union, 2013; U.S. Department of Agriculture, 2021). Consumer preference for farmed fish is generally mixed and species dependent. While several studies have reported consumer preference for wild-capture seafood, demand for farmed seafood has remained high for some species because of control in the production process, price, and availability (Claret et al., 2016; Rickertsen et al., 2017; López-Mas et al., 2020).
In the United States, production method (wild and/or farm-raised) must be properly labeled or designated on seafood. Acceptable designations are “wild caught,” “wild,” “farm-raised,” “farmed,” or a combination if the product is blended from both wild and farm-raised fish or shellfish. The information designation is a requirement for retailers but not food service establishments.
Product origin can be country of origin or a specific marine area where wild capture seafood is harvested. Country of origin is a mandatory requirement in the United States and European Union (European Union, 2013; U.S. Department of Agriculture, 2021). Origin information has allowed countries with strong sustainability guidelines to build reputations on quality and environmental responsibility, differentiating their products from competing nations (Alfnes, 2017). Common examples are American lobster, Alaska pollock, seafood from Norway, Atlantic cod, and European seabass. EU quality programs such as the Protected Geographical Indication (PGI) and Protected Designation of Origin (PDO) are used to promote general food quality (European Union, 2021b). Farmed and wild-capture salmon from Scotland use PGI status for marketing.
One of the major violations NOAA’s office of law enforcement deals with is intentional mislabeling of seafood for profit, but the broader benefits of country-of-origin labeling are for traceability and minimizing fraudulent practices associated with labeling.
Global seafood supply from aquaculture has significantly increased from the late twentieth century and currently accounts for about 52% of total global seafood used for human consumption. Seafood consumption is also increasing, driven by increased availability, increased disposable incomes, urbanization, price competitiveness with other proteins, and health and nutrition attributes of fish. Seafood is a major internationally traded commodity resulting in competitive markets. Consequently, increased standardization, certification and verification, and other informational programs have been developed and are being implemented in response to consumer attitudes and preferences as well as health, safety, and environmental concerns. The ultimate goals for these programs are to assure environmental and social responsibility, safety and quality standards, and consumer confidence in seafood in the marketplace.
Alfnes, F. 2017. “Selling Only Sustainable Seafood: Attitudes toward Public Regulation and Retailer Policies.” Marine Policy 78: 74–79.
Alfnes, F., X. Chen, and K. Rickertsen. 2018. “Labeling Farmed Seafood: A Review.” Aquaculture Economics and Management 22(1): 1–26.
Anderson, J.L., F. Asche, and T. Garlock. 2018. “Globalization and Commoditization: The Transformation of the Seafood Market.” Journal of Commodity Markets 12: 2–8
Ankamah-Yeboah, I., J.B. Jacobsen, S.B. Olsen, M. Nielsen, and R. Nielsen. 2019. “The Impact of Animal Welfare and Environmental Information on the Choice of Organic Fish: An Empirical Investigation of German Trout Consumers.” Marine Resource Economics 34(3): 247–266.
AquaBounty Technologies, Inc. 2021, May 4. “AquaBounty Technologies Announces First Quarter 2021 Financial Results.” Yahoo News. Available online: https://finance.yahoo.com/news/aquabounty-technologies-announces-first-quarter-200500216.html.
Asche, F., M.F. Bellemare, C. Roheim, M.D. Smith, and S. Tveteras. 2015. “Fair Enough? Food Security and the International Trade of Seafood.” World Development 67: 151–160.
Canadian General Standard Board. 2018. Organic Production Systems: Aquaculture - General Principles, Management Standards and Permitted Substances Lists. CAN/CGSB-32.312-2018. Available online: http://publications.gc.ca/collections/collection_2018/ongc-cgsb/p29-32-312-2018-eng.pdf.
Claret, A., L. Guerrero, I. Gartzia, M. Garcia-Quiroga, and R. Ginés. 2016. “Does Information Affect Consumer Liking of Farmed and Wild Fish?” Aquaculture 454: 157–162.
Del Giudice, T., S. Stranieri, F. Caracciolo, E.C. Ricci, L. Cembalo, A. Banterle, and G. Cicia. 2018. “Corporate Social Responsibility Certifications Influence Consumer Preferences and Seafood Market Price.” Journal of Cleaner Production 178: 526–533.
Engle, C.R., K.K. Quagrainie, and M.M Dey. 2017. Seafood and Aquaculture Marketing Handbook, 2nd ed. Chichester, UK: Wiley-Blackwell.
European Union. 2013. “Markets in Fishery and Aquaculture Products.” Official Journal of the European Union L354/1–21. Available online: https://eur-lex.europa.eu/lexuriserv/lexuriserv.do?uri=oj:l:2013:354:0001:0021:en:pdf.
European Union. 2021a. “Organic Production and Products: Rules on Wine Aquaculture and Hydroponics.” European Commission. Available online: https://ec.europa.eu/info/food-farming-fisheries/farming/organic-farming/organic-production-and-products_en#rulesonwineaquacultureandhydroponics.
European. 2021b. “Quality Schemes Explained.” European Commission. Available online: https://ec.europa.eu/info/food-farming-fisheries/food-safety-and-quality/certification/quality-labels/quality-schemes-explained_en.
Food and Agriculture Organization (FAO). 2020. “The State of World Fisheries and Aquaculture 2020. Sustainability in Action.” Rome, Italy: Food and Agriculture Organization of the United Nations.
Food and Drug Administration (FDA). 2020. “Labeling of Foods Comprised of or Containing Cultured Seafood Cells; Request for Information.” Federal Register 85(195): 63277–63280. Available online: https://www.govinfo.gov/content/pkg/fr-2020-10-07/pdf/2020-22140.pdf.
Food and Drug Administration (FDA). 2021. The Seafood List. Available online: https://www.cfsanappsexternal.fda.gov/scripts/fdcc/index.cfm?set=seafoodlist.
Kobayashi, M., S. Msangi, M. Batka, S. Vannuccini, M.M. Dey, and J. Anderson. 2015. “Fish to 2030: The Role and Opportunity for Aquaculture.” Aquaculture Economics & Management 19(3): 282–300.
Kumar, G., and C. Engle. 2016. “Technological Advances that Led to Growth of Shrimp, Salmon, and Tilapia Farming.” Reviews in Fisheries Science and Aquaculture 24(2): 136–152.
López-Mas, L., A. Claret, M.J. Reinders, M. Banovic, A. Krystallis, and L. Guerrero. 2020. “Farmed or Wild Fish? Segmenting European Consumers Based on Their Beliefs.” Aquaculture 532: 735992.
National Fisheries Institute (NFI). 2021. “NFI’s Top 10 List Suggests Consumers Diversifying Seafood Consumption.” Available online https://aboutseafood.com/press_release/nfis-top-10-list-suggests-consumers-diversifying-seafood-consumption/.
National Oceanic and Atmospheric Administration (NOAA). 2020. Fisheries of the United States, 2018. U.S. Department of Commerce, National Oceanic and Atmospheric Administration. Available online: https://www.fisheries.noaa.gov/resource/document/fisheries-united-states-2018-report.
National Oceanic and Atmospheric Administration (NOAA). 2021. Fisheries of the United States, 2019 Report. U.S. Department of Commerce, National Oceanic and Atmospheric Administration. Available online: https://www.fisheries.noaa.gov/resource/document/fisheries-united-states-2019-report.
Orlowski, A. 2017, December 17. “Organic Standards for US Farmed Seafood Going Nowhere Despite Market Demand.” SeafoodSource. Available online: https://www.seafoodsource.com/features/organic-standards-for-us-farmed-seafood-going-nowhere-despite-market-demand.
Prag, A., T. Lyon, and A. Russillo. 2016. “Multiplication of Environmental Labelling and Information Schemes (ELIS): Implications for Environment and Trade.” OECD Environment Working Papers No. 106. Available online: https://doi.org/10.1787/5jm0p33z27wf-en.
Rickertsen, K., F. Alfnes, P. Combris, G. Enderli, S. Issanchou, and J.F. Shogren. 2017. “French Consumers’ Attitudes and Preferences toward Wild and Farmed Fish.” Marine Resource Economics 32(1): 59–81.
Rubio, N., I. Datar, D. Stachura, D. Kaplan, and K. Krueger. 2019. “Cell-Based Fish: A Novel Approach to Seafood Production and an Opportunity for Cellular Agriculture.” Frontiers in Sustainable Food Systems 3(43): 1–13.
Shamshak, G.L., J.L. Anderson, F. Asche, T. Garlock, and D.C. Love. 2019. “US Seafood Consumption.” Journal of the World Aquaculture Society 50: 715–727.
Tveteras, S. 2015. “Price Analysis of Export Behavior of Aquaculture Producers in Honduras and Peru.” Aquaculture Economics and Management 19(1): 125–147.
UN Convention on the Law of the Sea (UNCLOS). 1982. Available online: https://www.un.org/depts/los/convention_agreements/texts/unclos/unclos_e.pdf.
U.S. Department of Agriculture (USDA). 2020. Food Availability (per Capita) Data System. Available online: https://www.ers.usda.gov/webdocs/datafiles/50472/meat.xls?v=5661.
U.S. Department of Agriculture, Agricultural Marketing Service. 2021. “Electronic Code of Federal Regulations – PART 60—Country of Origin Labeling for Fish and Shellfish.” Federal Register 74: 2657–2707. Available online: https://www.ecfr.gov/current/title-7/part-60.

