This article documents the importance of globalized seafood markets and aquaculture (where we define aquaculture as the farming of aquatic animals or plants in a controlled setting) in U.S. seafood markets. The United States has become a major importer of seafood products; between 1998 and 2018, U.S. seafood imports approximately doubled, from just over 1.5 million tons to 3 million tons (National Marine Fisheries Service, 2019). Two factors partially explain this transition: (i) steady increases in demand for seafood in the United States, mostly due to population growth and (ii) the fact that seafood production has grown more rapidly in other countries than in the United States, driven principally by developments in aquaculture. This article documents these trends using data on domestic consumption, capture fisheries versus farmed fish production, and U.S. seafood imports. Our analysis also traces the pattern of aquaculture growth in the United States relative to the major seafood suppliers. Close study of aquaculture is important because seafood markets have undergone a dramatic globalized transition over the past few decades, with many capture fisheries experiencing either unsustainable overfishing (34.2%) or catch that has reached its maximum sustainable yield (59.6%) (UNFAO, 2020). This implies that future increases in seafood supply will need to be met through aquaculture.
This article synthesizes the ongoing discussions on U.S. seafood markets in three ways. First, we describe the growth in seafood demand. Second, we document the rapid increase in other countries’ seafood production, with a particular focus on the increase in aquaculture production in those countries relative to the United States. Third, we examine which countries are selling the highest value of seafood products in U.S. seafood markets.
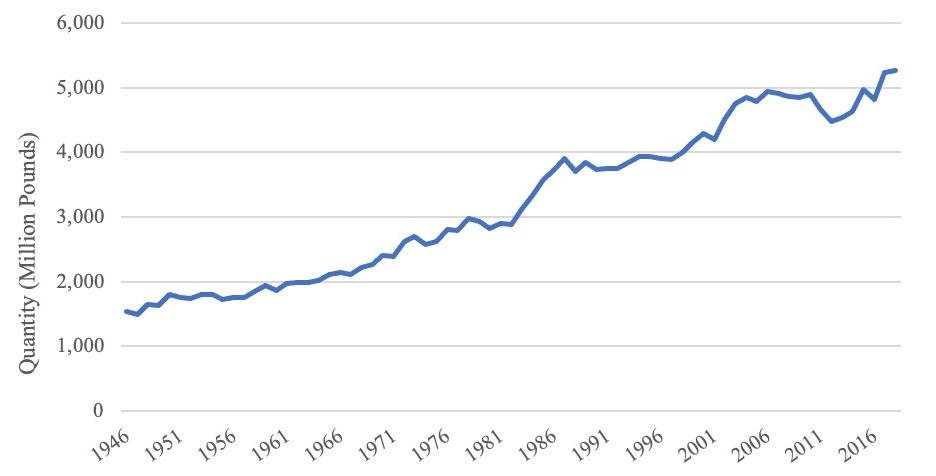
Source: U.S. Department of Agriculture (2021c) based on data
from the U.S. Department of Commerce, National Marine
Fisheries Service (NMFS).
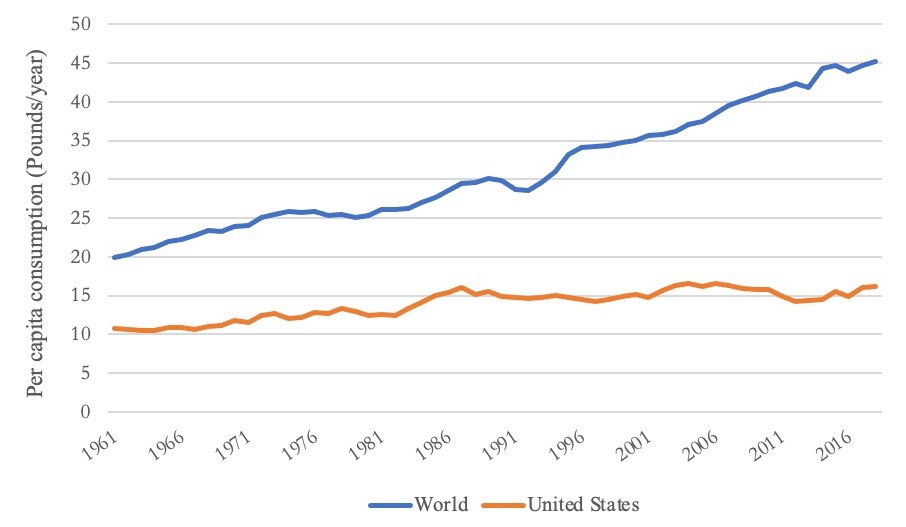
Notes: U.S. per capita consumption in edible meat weight
(boneless equivalent weight). World per capita consumption
comprises total supply available for consumption (live weight)
without accounting for waste or losses; hence, these estimates
are overestimated compared to actual intake.
Source: United Nations Food and Agriculture Organization
(2020), Fish, Seafood-Food Supply Quantity (kg/capita/yr.) and
U.S. Department of Agriculture (2021c).
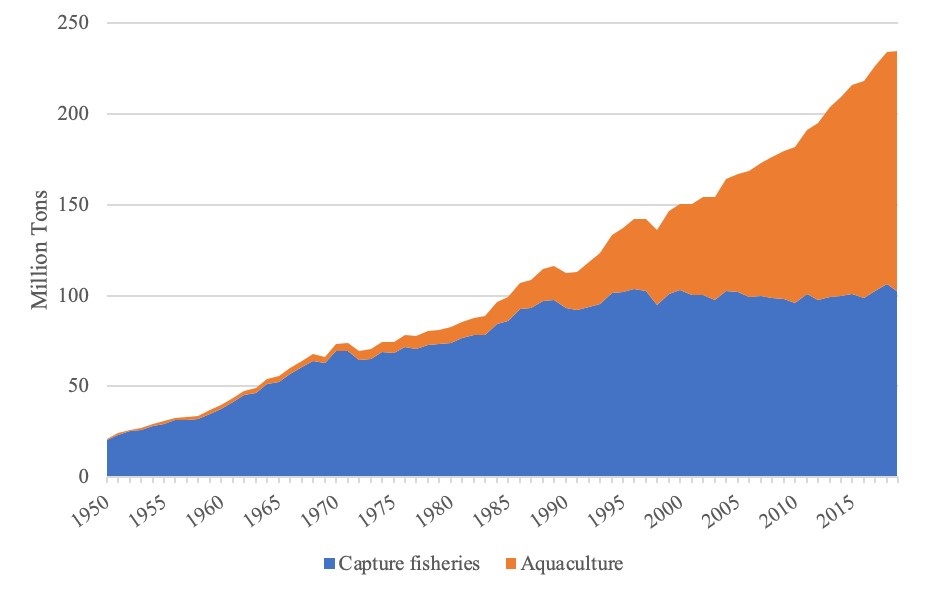
Source: United Nations Food and Agriculture Organization
(2021).
Total U.S. demand for seafood increased 41% between 1990 and 2018 (Figure 1). Population growth is the primary driver behind this trend (Shamshak et al., 2019; Love et al., 2020). Between 1990 and 2020, the U.S. population increased from 250 million to 330 million. However, average individual consumption of seafood in the United States has changed relatively little over several decades (Figure 2), fluctuating around 15 pounds per person per year since the 1990s (Shamshak et al., 2019). It is worth noting, however, that there exists a marked spatial variability in seafood consumption across the United States. Seafood consumption rates among adults in the coastal Northeast and Pacific regions are among the highest in the United States and lowest in the inland Midwest and Great Lakes regions (Love et al., 2020).
Despite relatively flat per capita consumption, the composition of the U.S. seafood market is changing. Consumers are shifting away from products such as canned tuna, cod (mostly Atlantic cod), and Alaska pollock, which were among the most consumed species in the 1990s, to catfish (including Pangasius), tilapia, shrimp, and salmon (including Pacific and Atlantic salmon); along with canned tuna, these five species now make up 70% of total seafood consumption in the United States (Shamshak et al., 2019). Apart from canned tuna, it should be noted that aquaculture contributes heavily to the production volumes of these species (Anderson, Asche, and Garlock, 2018; Shamshak et al., 2019). Thus, consumption of farmed aquatic animals has increased markedly in the United States because of changing consumer tastes and preferences, and farmed species now have a large share of the overall U.S. food fish market.
Global consumption of seafood per capita has risen steadily since 1961 (Figure 2). In contrast to the United States, per capita seafood consumption (by weight) more than doubled globally between 1961 and 2018. Rising incomes have contributed to this trend, with fish consumption accounting for 17% of the global population’s animal protein intake (UNFAO, 2020). It is likely that this trend in global seafood demand will persist as global average income is expected to increase significantly in the coming decades (Béné et al., 2015) and diets shift toward animal protein consumption. Increasing demand for seafood and other fish products has helped spur growth in global aquaculture production (Abate, Nielsen, and Tveterås, 2016; Cao et al., 2007; UN Food and Agriculture Organization, 2020).
Seafood is produced from two main sources: capture fisheries and aquaculture. Given growing concerns about over-fishing, aquaculture production has gained prominence over the last few decades, nearly overtaking capture fisheries in total volume. United Nations Food and Agriculture Organization (UNFAO) (2020) statistics reveal that aquaculture production made up about 46% of global seafood production and 52% of fish for human consumption in 2018. Total aquaculture supply increased significantly, from 47 million tons in 2000 to 126 million tons by live weight in 2018 (UNFAO, 2020).
| 1990 | Country | Million Tons | Share of World Production |
| 1 | China | 16.6 | 14.8% |
| 2 | Japan | 12.1 | 10.7% |
| 3 | Russia (USSR) | 8.4 | 7.5% |
| 4 | Peru | 7.6 | 6.7% |
| 5 | United States | 6.5 | 5.8% |
| 2018 | Country | Million Tons | Share of World Production |
| 1 | China | 89.0 | 38.0% |
| 2 | Indonesia | 25.3 | 10.8% |
| 3 | India | 13.8 | 5.9% |
| 4 | Vietnam | 8.3 | 3.5% |
| 5 | Peru | 8.0 | 3.4% |
Notes: Selected group species include the "fish, crustaceans, mollusks, etc."
category, ignoring aquatic plants and other aquatic animals and products production.
Source: United Nations Food and Agriculture Organization (2021).
Table 1 presents data on the shifts in general seafood production among the historical global-leading seafood producers, based on data from the UNFAO’s FishstatJ Database. China, Russia, and Japan produced much of the world’s seafood products in 1990; in that year, the top five producers of seafood accounted for close to half of the world’s production volume. Three decades later, three of the five formerly top seafood-producing countries fell out of this list, replaced by Indonesia, India, and Vietnam. However, Chinese seafood production has increased nearly six-fold during this time, making it the leading producer of seafood products in 2018 by a large margin. China is both a leading exporter and importer of seafood products (UNFAO, 2020). As Chinese consumers’ purchasing power continues to grow, early projections suggest that Chinese seafood consumption will soon surpass domestic production (Crona et al., 2020). If realized, this trend will have important implications for economies that depend on seafood imports as China redirects domestic production to meet local demand.

Source: United Nations Food and Agriculture Organization
(2021).
Given the global stagnation in capture fisheries, the surge in general seafood production among these emerging economies is mainly due to investments in aquaculture (Bush et al., 2013). The transition from capture fisheries dependence to aquaculture has been significant for each of the current top five seafood producers. As of 2013, aquaculture’s share of seafood production was relatively greater than that of capture fisheries in China, India, and Vietnam, with aquaculture production volume growing at least twice as fast as volumes from capture fisheries (Belton and Thilsted, 2014). Apart from Peru, aquaculture now marginally dominates total capture fisheries production across these top seafood producers in terms of total volume.
| Year | Growth Rate (%) | |||||
| United States | China | India | Indonesia | Philippines | Vietnam | |
| 1951 | 10.6 | 93.8 | 9.2 | 1.4 | 16.5 | 0.3 |
| 1955 | 14.1 | 17.0 | 9.6 | 13.2 | 13.4 | 12.9 |
| 1950 | 1.3 | 6.7 | 10.0 | 0.6 | 3.6 | 7.9 |
| 1965 | 7.0 | 14.0 | 10.4 | 0.8 | 2.7 | 5.7 |
| 1971 | -1.8 | 21.0 | 12.3 | 5.0 | 4.0 | 4.6 |
| 1972 | 4.9 | 11.0 | 12.6 | 4.2 | 1.6 | 4.2 |
| 1973 | -1.9 | -8.3 | 12.4 | 9.1 | 3.3 | 4.2 |
| 1974 | -1.9 | 8.4 | 11.1 | 4.9 | 26.2 | 4.0 |
| 1975 | 30.8 | 9.2 | 11.2 | 9.8 | -4.7 | 4.1 |
| 1976 | -15.8 | -2.4 | 11.4 | 4.8 | 7.4 | 4.0 |
| 1977 | -5.2 | 32.4 | 11.3 | 10.9 | 13.2 | 4.1 |
| 1978 | -8.9 | 7.1 | 11.3 | 8.9 | 37.7 | 4.3 |
| 1979 | -12.5 | -2.9 | 11.3 | 6.8 | 16.6 | 4.3 |
| 1980 | 21.1 | 7.0 | 11.3 | 11.4 | 27.7 | 4.7 |
| 1985 | -0.9 | 17.7 | 10.7 | 8.7 | 3.5 | 8.8 |
| 1990 | -14.5 | 3.6 | 1.3 | 13.6 | 6.6 | -1.7 |
| 1995 | 5.6 | 16.1 | 9.2 | 5.6 | 8.2 | 13.1 |
| 2000 | -4.7 | 6.2 | -9.0 | 12.5 | 5.0 | 24.2 |
| 2005 | -15.4 | 4.8 | 6.0 | 44.6 | 10.4 | 19.7 |
| 2010 | 3.2 | 3.7 | -0.2 | 33.2 | 2.8 | 5.1 |
| 2011 | -20.0 | 2.8 | -3.0 | 26.4 | 2.4 | 5.9 |
| 2016 | 4.4 | 5.0 | 8.3 | 2.3 | -6.3 | 3.1 |
| 2017 | -1.1 | 3.3 | 8.5 | 0.7 | 1.7 | 7.0 |
| 2018 | 6.0 | 2.8 | 16.1 | -2.1 | 3.0 | 8.6 |
| 2019 | 5.2 | 3.5 | 8.6 | 0.8 | 2.3 | 7.0 |
| Average | 3.6 | 11.4 | 9.3 | 9.4 | 7.2 | 10.0 |
Source: United Nations Food and Agriculture Organization (2019).
The composition of seafood production in the United States, however, stands apart from this global trend. Farming of aquatic species constitutes a minimal fraction of U.S. seafood production. As of 2019, aquaculture contributed less than 1% of total U.S. seafood production volume (for both food and nonfood use) (Figure 4). Yet about half of U.S. seafood imports are produced by aquaculture, which thus feeds a large share of U.S. seafood consumers because more than half of U.S. seafood is imported. By contrast, over 99% of all chicken meat consumed in the United States (by weight) is domestically produced (U.S. Department of Agriculture, 2021a). U.S. aquaculture production grew from 0.51 million tons in 2000 to 0.54 million tons in 2019 (UNFAO, 2021). The last two decades have presented serious challenges to the U.S. aquaculture industry, including a surge in feed prices (Engle and Stone, 2013), several recessions, and increasing globalization. For domestic aquaculture producers, passing production cost increases on to U.S. consumers has become increasingly difficult due to competition with imported seafood (see Alabama Co-Operative Extension System, 2018, for comments on the effect of catfish-like imports on U.S. seafood markets).
Using the UNFAO’s Global Aquaculture Production data, we describe how U.S. aquaculture has fared in terms of growth relative to the top seafood producing countries. In our analysis, we exclude production figures from aquatic plants, pearls, and mother-of-pearl for both food and nonfood use. Using production statistics from 1951, we compute the year-on-year growth in aquaculture production volume for the United States and compare these results with some of the world’s leading seafood producers. These values are calculated as simple percentage changes from the previous year.
| Country | Leading species | Total Aquaculture Production (million tons) |
Total Capture Fisheries Production (million tons) |
| China | Catfish (including Pangasius), Tilapia |
52.5 | 16.2 |
| India | Shrimp | 7.8 | 5.8 |
| Chile | Salmon | 1.4 | 2.3 |
| Thailand | Tuna | 1.0 | 1.9 |
Source: United Nations Food and Agriculture Organization (2021).
Table 2 shows the rate of aquaculture production growth by country between 1951 and 2019. The United States has the lowest average annual growth rate in the period under consideration. Since 1951, aquaculture production in the United States grew by an average rate of 3.6% annually, compared to 10.0% in Vietnam, 7.2% in the Philippines, 9.4% in Indonesia, 9.3% in India, and 11.4% in China. Table 2 also shows that the United States has experienced several years of declining aquaculture production since the 1970s. That is, not only has U.S. aquaculture been unable to keep pace with the growth in farmed seafood among the global leaders, but it has in fact lost ground compared to historical U.S. production volumes. For example, one of the worst declines in aquaculture production in the United States occurred in 2011, when the industry recorded a growth rate of -20%. Import competition and surging input costs affecting the U.S. catfish industry, which dominated domestic aquaculture production at the time, explain part of this contraction (Alabama Co-Operative Extension System, 2018). Vietnam experienced a similar-sized dip in growth in 1995, but this decline was largely offset by periods of strong recovery in the following years. Although much of China’s growth in aquaculture production was realized early on (in the 1950s), the industry achieved annual growth rates greater than 10% until the late 2000s; since then, growth rates have ranged between approximately 3% and 6%.
By contrast, other top seafood producers—such as Indonesia and India—continue to report sustained growth in aquaculture production. For these emerging economies, rapid dietary diversification—fueled by rising incomes—toward meat and seafood have revolutionized domestic aquaculture production, such as in the rapid commoditization of nonnative, efficiently farmed species like tilapia (Hernandez et al., 2018). Seafood is becoming an integral part of the diets of many households in developing countries, creating private and public interest in aquaculture.
The United States is a large net importer of seafood, with between 70% and 85% of seafood consumed domestically originating abroad (NOAA, 2021a), although some estimates imply a lower range of 62%–65% (Gephart, Froehlich, and Branch, 2019). Approximately half of these seafood imports are farmed (aquaculture products). Import volumes remain high despite some top aquaculture exporting countries having been accused of unfairly dumping to gain larger shares of U.S. seafood markets. Dumping occurs when producers export a product at a price lower than the normal market price. For example, in June 1997, Chilean salmon exporters were accused of receiving government subsidies and practicing dumping on U.S. markets (Bjørndal, 2002). Thorough investigations into Chilean exporters’ practices revealed that some Atlantic salmon producers were guilty of illegally undercutting the going market price, which eventually led to the imposition of additional import duties (Bjørndal, 2002). Despite a guilty verdict and import duties, exports of Chilean salmon to U.S. markets have continued to grow. Similarly, the U.S. Department of Commerce placed anti-dumping duties on Vietnamese catfish-like products (Pangasius), although these were subsequently lowered upon appeal (Dao, 2018).
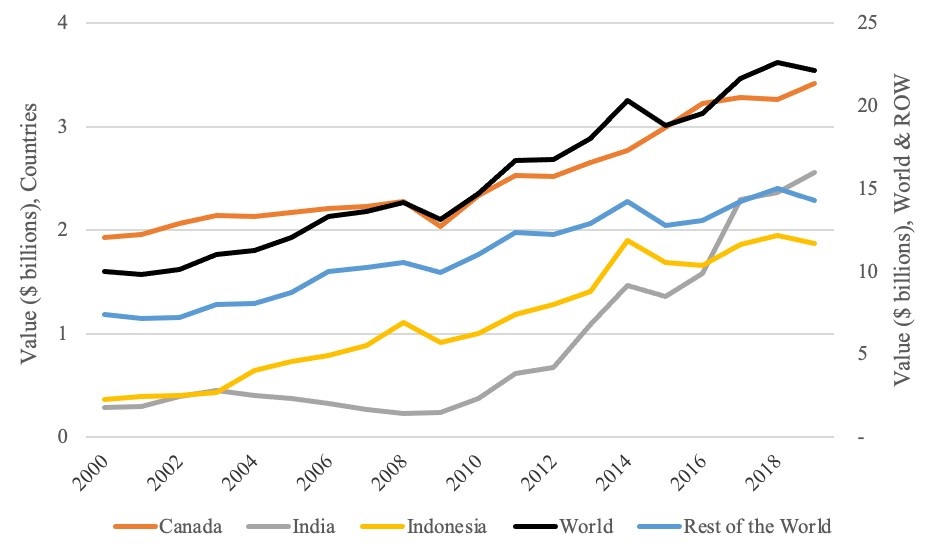
Source: U.S. Department of Agriculture (2021b).
Source: U.S. Department of Agriculture (2021b).
China, Chile, and Vietnam have proved crucial in meeting the growing demand for seafood in the United States. (Aquatic Network, 2021). However, this also represents an opportunity for domestic aquaculture producers to capture some market share. Figure 5 reports historical data on the total value of U.S. seafood imports across all species. The overall trend remains the sustained growth in U.S. seafood imports since 2000. Figure 5 indicates that seafood imports have largely survived the recent protectionist policies that adversely impacted other imported products and commodities.
Canada exports the most by value to the United States, followed by India and Indonesia. Canada commands a strong niche in Atlantic salmon production (Nguyen and Williams, 2013; Weitzman and Bailey, 2019). The Canadian aquaculture industry provides an interesting case study from which some lessons can be drawn. Open net-pen salmon farming dominates Canadian aquaculture, which has become a driving force behind Canada’s strong aquaculture growth (Weitzman and Bailey, 2019).
For other countries such as Chile—where salmon is not a native fish (Bjørndal, 2002)—the rise to capture a sizable market niche in salmon production is quite notable. Chile benefits from a rugged coastline with close to ideal habitat conditions. However, Chile’s giant leap in aquaculture production cannot be attributed solely to its suitable growing conditions. Cost advantages from low wages at both the farming and processing stages in the value chain have contributed to the industry’s success. Vertical integration is another feature characterizing Chilean salmon production. Since the early 1990s, the average firm size in the industry has continued to grow as companies assume greater responsibility for the farming, processing, and marketing of Atlantic salmon and trout (Bjørndal, 2002). Overreliance of the industry on imported fish eggs (about one-third imported from the United States) and rising fish meal costs, however, represent potential threats to its competitiveness.
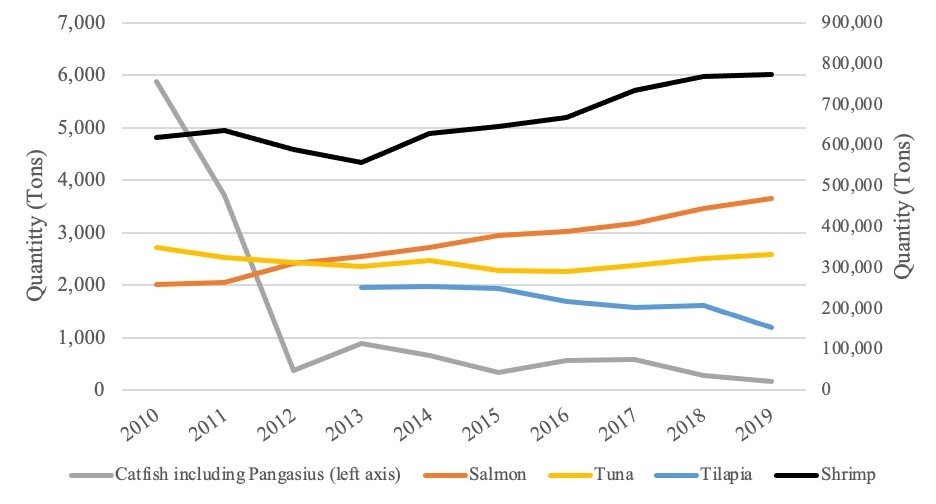
Figure 6 illustrates U.S. seafood import volumes since 2010 for the top five most consumed species. Our analysis does not allow us to distinguish imports for food consumption from other possible uses. Shrimp is the most imported species by volume and that, since 2010, the volume of imported shrimp into the United States (mostly from India and Indonesia) has increased by about 33%. On the other hand, tuna imports (in all forms) into the United States have changed little, with a small increase after 2015 mostly because of strong growth in canned tuna and frozen tuna fillet imports (NOAA, 2021b).
Atlantic salmon is the second most imported species into the United States. It remains one of the most important sources of seafood in the diets of U.S. consumers. Between 2010 and 2019, the total volume of U.S. salmon imports almost doubled, from 258,000 tons to 470,000 tons. By contrast, U.S. tilapia imports declined by 39% between 2013 and 2019 (see Figure 6). This declining trend may offer credence to some of the highly publicized issues of food contamination and adulteration in Asia, mostly China, given that China is the leading exporter of tilapia to the United States (Ortega, Wang, and Widmar, 2014). Another species with most U.S. imports originating in China is catfish-like fish (including Pangasius). Similarly, we observe a declining trend in U.S. catfish (including Pangasius) imports, with a particularly drastic dip between 2010 and 2012. Figure 6 also shows that catfish imports have more or less stabilized since then.
Formerly a top world seafood producer, the U.S. share of global seafood supply has declined over the past several decades, with imports now contributing to the bulk of domestic seafood consumption. U.S. seafood consumption per capita is stable, but aggregate consumption is increasing; thus, it is likely that imports of the top species into the U.S. seafood market will experience sustained growth. Growth of U.S. production has lagged that of the top international seafood producers, mainly because of minimal growth in the U.S. aquaculture industry.
A natural response to information about the state of U.S. seafood production and imports is to ask why other countries have come to dominate production, particularly in aquaculture. Unfortunately, this question has not yet received enough study that we can provide an answer with confidence. Aquaculture experts and academic research suggest that the difference may be partially due to regulatory hurdles. Regulations are designed to affect production practices that, in turn, can affect producers’ ability to grow their business. One should not be surprised that U.S. regulations may be relatively more burdensome, due to the country’s federal governing structure, record of strong environmental and food safety laws, and public and agency concerns about water quality (Knapp and Rubino, 2016). However, the sum effect of these factors on the U.S. aquaculture industry remains unclear and needs further study. Research using producer surveys and cross-country analysis points toward a link between production volumes and regulations (Engle and Stone, 2013; Abate, Nielsen, and Tveterås, 2016), although there has yet to be a study establishing a robust, causal pathway. Nevertheless, government action in some form appears necessary to make U.S. aquaculture a more significant contributor to domestic and global seafood production. This could range from streamlining state and federal laws to incentivizing seafood co-operatives or offering financial and technical support for producers. Similar actions have occurred in countries that have become dominant in aquaculture and seafood production, such as Norway, where producers apply for a general permit through the national authority and a single license through the regional government to limit regulatory complexity (Alexander et al., 2015).
Abate, T.G., R. Nielsen, and R. Tveterås. 2016. “Stringency of Environmental Regulation and Aquaculture Growth: A Cross-Country Analysis.” Aquaculture Economics & Management 20(2): 201–221.
Alabama Cooperative Extension System. 2018. Aquatic Resources Team: Project Activities and Impacts 2017. Alabama A&M and Auburn Universities Extension publication ANR 2458.
Alexander, K.A., T.P. Potts, I.D. Freeman, J. Johansen, D. Kletou, M. Meland, D. Pecorino, C. Rebours, M. Shorten, and D.L. Angel. 2015. “The Implications of Aquaculture Policy and Regulation for the Development of Integrated Multi-trophic Aquaculture in Europe.” Aquaculture 443: 16–23.
Anderson, J.L., F. Asche, and T. Garlock. 2018. “Globalization and Commoditization: The Transformation of the Seafood Market.” Journal of Commodity Markets, 12: 2–8.
Aquatic Network. 2021. U.S. Seafood Import and Export Trends. Available online: https://www.aquanet.com/us-seafood-trends.
Belton, B, and S.H. Thilsted. 2014. “Fisheries in transition: Food and nutrition security implications for the global South.” Global Food Security 3: 59–66.
Béné, C., M. Barange, R. Subasinghe, P. Pinstrup-Andersen, G. Merino, G.I. Hemre, and M. Williams. 2015. “Feeding 9 Billion by 2050—Putting Fish Back on the Menu.” Food Security 7: 261–274.
Bittenbender, S. 2018, December 14. “NOAA Fisheries Reports Increase in Seafood Consumption and Landings.” SeafoodSource. Available online: https://www.seafoodsource.com/news/supply-trade/noaa-fisheries-reports-increase-in-seafood-consumption-and-landings.
Bjørndal, T. 2002. “The Competitiveness of the Chilean Salmon Aquaculture Industry.” Aquaculture Economics & Management 6(1–2): 97–116.
Boyd, C.E., and A.A. McNevin. 2015. Aquaculture, Resource Use, and the Environment. Hoboken, NJ: Wiley.
Bush, S.R., B. Belton, D. Hall, P. Vandergeest, F.J. Murray, S. Ponte, P. Oosterveer, M.S. Islam, A.P.J. Mol, M. Hatanaka, F. Kruijssen, T.T.T. Ha, D.C. Little, and R. Kusumawati. 2013. “Certify Sustainable Aquaculture?” Science 341(6150): 1067–1068.
Cao, L., W. Wang, Y. Yang, C. Yang, Z. Yuan, X. Shanbo, and D. James. 2007. “Environmental Impact of Aquaculture and Countermeasures to Aquaculture Pollution in China.” Environmental Science & Pollution Research 14(7): 452–462.
Crona, B., E. Wassénius, M. Troell, K. Barclay, T. Mallony, M. Fabinyi, W. Zhang, V.W.Y. Lam, L. Cao, P.J.G. Henriksson, and H. Eriksson. 2020. “China at a Crossroads: An Analysis of China’s Changing Seafood Production and Consumption.” One Earth 3(1): 32–44.
Dao, T. 2018, March 21. “High Antidumping Duties Have Vietnam’s Pangasius Vendors Forsaking U.S. Market.” SeafoodSource. Available online: https://www.seafoodsource.com/features/high-antidumping-duties-have-vietnams-pangasius-vendors-foresaking-us-market.
Engle, C.R., and N.M. Stone. 2013. “Competitiveness of U.S. Aquaculture within the current U.S. regulatory framework.” Aquaculture Economics & Management 17: 251–280.
Engle, C.R., and D. Valderrama. 2002. “The Economics of Environmental Impacts of Aquaculture in the United States.” In J. Tomasso, ed. Aquaculture and the Environment in the United States. Baton Rouge, LA: U.S. Aquaculture Society.
Gephart, J.A., H.E. Froehlich, and T.A. Branch. 2019. “Opinion: To Create Sustainable Seafood Industries, the United States Needs a Better Accounting of Imports and Exports.” Proceedings of the National Academy of Sciences 116(19): 9142–9146.
Hernandez, R., B. Belton, T. Reardon, C. Hu, X. Zhang, and A. Ahmed. 2018. “The ‘Quiet Revolution’ in the Aquaculture Value Chain in Bangladesh.” Aquaculture 493: 456–468.
Knapp, G., and M.C. Rubino. 2016. “The Political Economics of Marine Aquaculture in the United States.” Reviews in Fisheries Science & Aquaculture 24(3): 213–229.
Love, D.C., F. Asche, Z. Conrad, R. Young, J. Harding, E.M. Nussbaumer, A.L. Thorne-Lyman, and R. Neff. 2020. “Food Sources and Expenditures for Seafood in the United States.” Nutrients 12(6): 1810.
Ortega, D.L., H. Wang, and N.O. Widmar. 2014. “Aquaculture Imports from Asia: An Analysis of U.S. Consumer Demand for Select Food Quality Attributes.” Agricultural Economics 45: 1–10.
National Marine Fisheries Service. 2019. Commercial Fisheries Statistics. Available online: https://www.st.nmfs.noaa.gov/commercial-fisheries/foreign-trade/index.
National Oceanic and Atmospheric Administration. 2021a. U.S. Aquaculture. Available online: https://www.fisheries.noaa.gov/national/aquaculture/us-aquaculture.
National Oceanic and Atmospheric Administration. 2021b. U.S. Trade in Fishery Products. Available online: https://www.fisheries.noaa.gov/foss/f?p=215:22:20165797972349::NO:::.
Nguyen, T., and T. Williams. 2013. “Aquaculture in Canada.” Library of Parliament, Canada, Publication No. 2013-12-E, February.
Shamshak, G.L., J.L. Anderson, F. Asche, T. Garlock, and D.C. Love. 2019. “U.S. Seafood Consumption.” Journal of the World Aquaculture Society 50: 715–727.
United Nations Food and Agriculture Organization. 2019. FishstatJ Universal Software for Fishery Time Series. Rome, Italy: FAO Fisheries and Aquaculture Department.
United Nations Food and Agriculture Organization. 2020. The State of the World Fisheries and Aquaculture: Sustainability in Action. Rome, Italy: FAO.
United Nations Food and Agriculture Organization. 2021. Fishery and Aquaculture Statistics. Global Aquaculture Production 1950-2019 (FishstatJ), Updated 2021. Available online: www.fao.org/fishery/statistics/software/fishstatj/en.
U.S. Department of Agriculture. 2021a. Livestock and Poultry: World Markets and Trade. Washington, D.C.: U.S. Department of Agriculture, Foreign Agricultural Service, July. Available online: https://downloads.usda.library.cornell.edu/usda-esmis/files/73666448x/9593vs24n/4m90fs46x/livestock_poultry.pdf.
U.S. Department of Agriculture. 2021b. Global Agricultural Trade System Online. Washington, D.C.: U.S. Department of Agriculture, Foreign Agricultural Service. Available online: https://apps.fas.usda.gov/GATS/default.aspx.
U.S. Department of Agriculture. 2021c. Food Availability (Per Capita) Data System. Washington, D.C.: U.S. Department of Agriculture, Economic Research Service. Available online: https://www.ers.usda.gov/data-products/food-availability-per-capita-data-system/.
Weitzman, J., and M. Bailey. 2019. “Communicating a Risk-Controversy: Exploring the Public Discourse on Net-Pen Aquaculture within the Canadian Media.” Aquaculture 507: 172–182.

