Laws regulating food systems are complex, overlapping, and decentralized. They are complex because the laws must account for the delicate intricacies and objectives of a supply chain; overlapping because the legislation regulating food production, safety, and distribution are constructed through amendments to decade-old statutes; and decentralized because they involve local, state, and federal policy makers who grant enforcement jurisdiction to multiple agencies. While these regulations are often written to encourage ethical business practices, protect consumers, workers, and the environment, and promote animal welfare, they may hinder industry growth, prevent innovation, and generate higher consumer prices (Malone and Lusk, 2016; Mullally and Lusk, 2018; Chambers, Collins, and Krause, 2019).
The first major food policy initiatives in the United States were introduced in the early twentieth century after the publication of Upton Sinclair’s notorious book The Jungle (Fortin, 2017). The Pure Food and Drug Act of 1906 and the Meat Inspection Act of 1906 addressed the need to protect consumers from illness, fraud, and other accounts of malpractice. After advancements in refrigeration technology, improvements in transportation, and a rise in the standard of living, the Pure Food and Drug Act of 1906 was quickly outdated, and it was replaced by the Food, Drug, and Cosmetic Act (FD&C) of 1938.1 The FD&C of 1938, along with the Meat Inspection Act of 1906, still serve as the foundation of modern-day food law. Of course, the number of food regulations have increased tremendously over the last century, but the restrictiveness of these constraints may not be distributed evenly across different food supply chains. For instance, recent studies have suggested that the U.S. aquaculture industry—a nascent industry compared to the U.S. beef, pork, and poultry industries—may be “over-burdened” by regulations, resulting in higher production costs and slower market growth rates (Abate, Nielsen, and Tveterås, 2016; Knapp and Rubino, 2016; van Senten and Engle, 2017). Relatedly, Staples et al. (2021) examine the number of restrictive words in federal law matched to industries across various U.S. protein supply chains (cattle, hog and pig, poultry, sheep and goat, and aquaculture) from 1970 to 2019. Though simply counting the number of restrictive words cannot be considered a complete measure of regulatory burden, the study notes that regulatory restrictions have grown steadily across all protein industries and that the total regulatory language constraining the aquaculture industry is greater than that of the other protein sources studied. This article extends previous examinations of aquaculture regulations by tracing the development of U.S. aquaculture supply chain regulatory restrictions and discussing the factors that could be driving the recent growth in regulations.
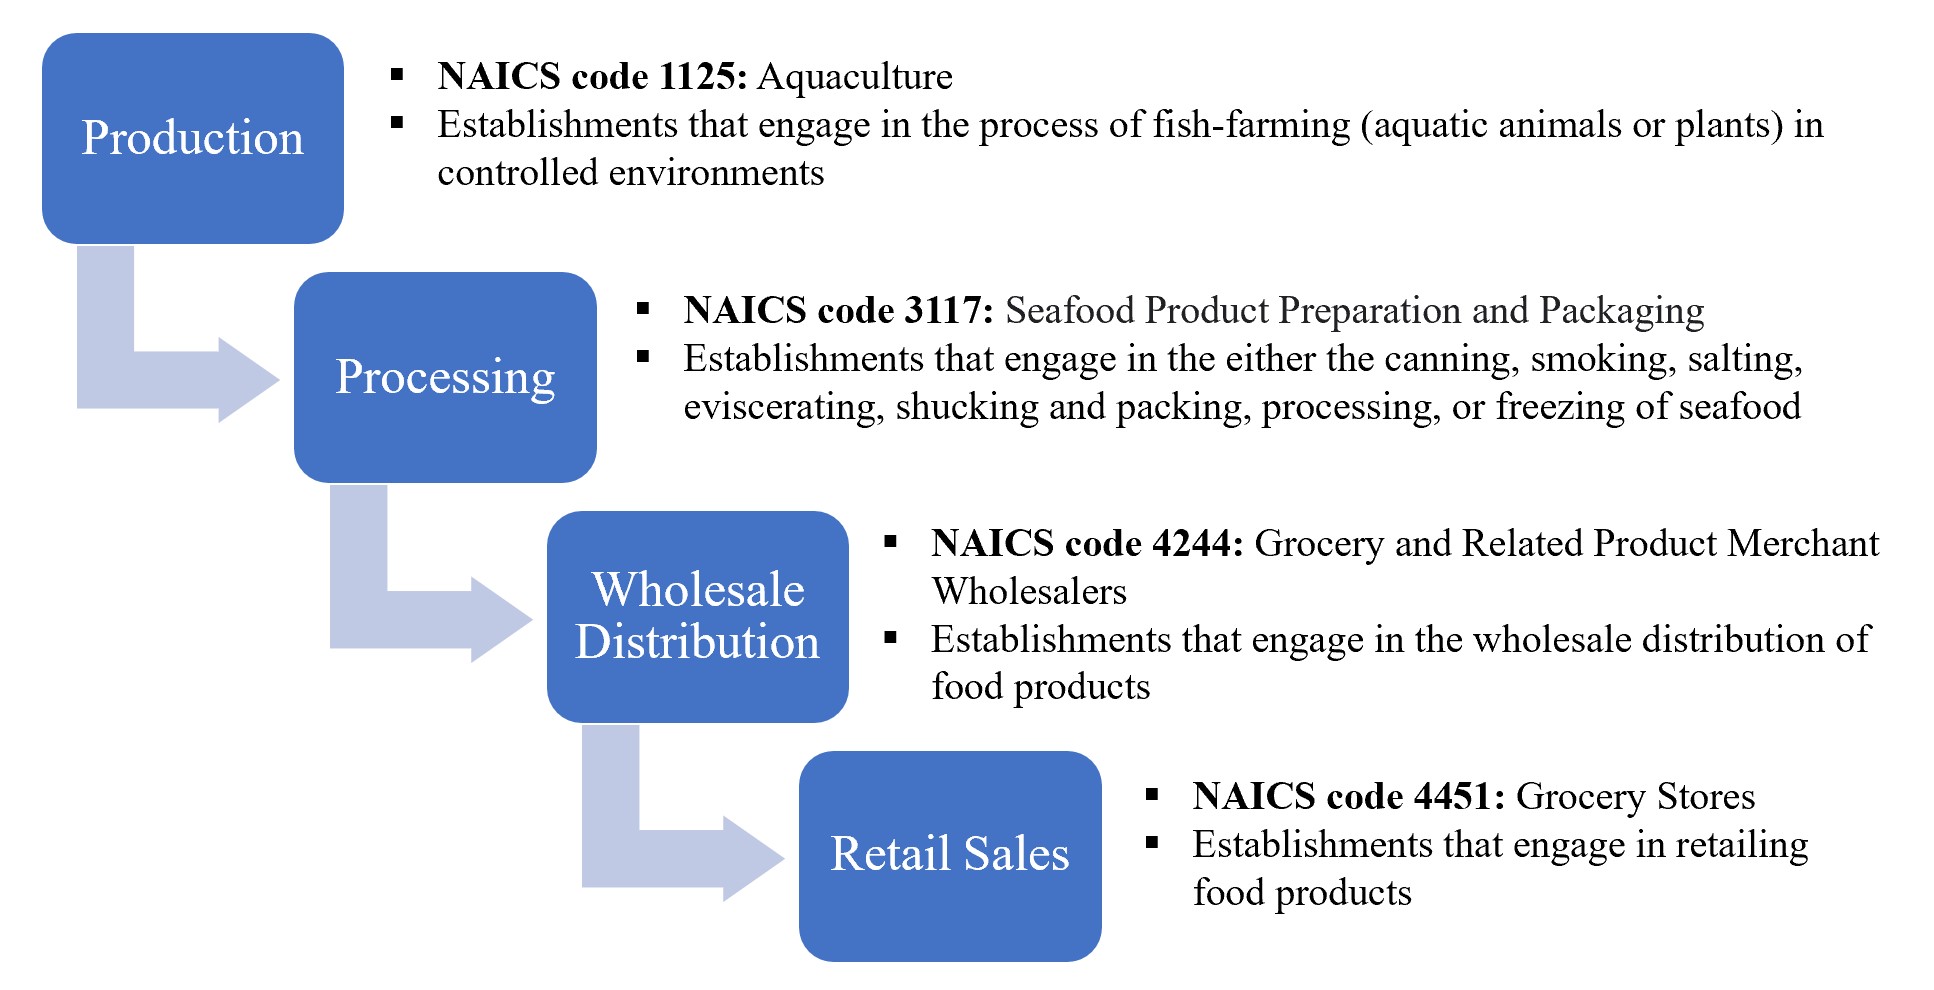
We present quantitative data on federal and state aquaculture regulatory restrictions using Mercatus Center RegData 3.2, mirroring Staples et al. (2021). This database counts each instance that a binding federal restriction—specifically, the words “shall,” “must,” “may not,” “prohibited,” or “required”—appears in the United States Code of Federal Regulations (CFR) and weights the restriction by the probability that it applies to a given industry. The measure of industry relevance is generated using a machine-learning algorithm trained on the lexigraphy of industry-specific texts, and thus the total regulatory restrictions for a given industry is the equal to the probability-weighted sum of regulatory restrictions using the industry’s specific weighting matrix.2 Here, we assume that the aquaculture supply chain is represented by a four-step process proxied using the industry’s corresponding North American Industry Classification System (NAICS) code: (i) production; (ii) processing; (iii) wholesale distribution; and (iv) retail sales. Our aquaculture supply chain and the four-digit NAICS code corresponding to each stage of the supply chain are presented in Figure 1.
The federal data span the CFR from 1970 to 2019, allowing us to address the relative changes in the aquaculture supply chain regulatory constraints over the past half-century. Upon presentation of recent trends, we discuss large-scale food policy initiatives and environmental regulations that may be driving the increase in aquaculture regulatory restrictions in recent years. We then analyze heterogeneity across state supply chains using 2020 state-level RegData before concluding with a discussion of recent legislation pertaining to the future of the aquaculture industry.
Although federal statutes receive significant media attention after they are passed by Congress and signed into law by the president, the regulations enforcing these statutes take several years to codify into the CFR. Once a bill is signed into law, the agency with presiding jurisdiction over the statute will publish their initial interpretation of the law in the Federal Register, serving as an interim rule to inform the public and industry stakeholders about the proposed regulations. After a period for public comment, the initial ruling is revised, the agency responds to comments, and the final ruling and enforcement dates are announced in the Federal Register. At this point, the final regulations are codified in the CFR.
For most food products, including aquaculture, the Food and Drug Administration (FDA) has authority to monitor and enforce regulations stemming from the FD&C Act of 1938. Interestingly, cattle, hog and pig, and poultry production fall under the jurisdiction of the U.S. Department of Agriculture (USDA), not the FDA. While the overarching goals of these federal agencies are similar, and they sometimes work in conjunction with one another, this separation and complexity in regulatory oversight means that industries involved in protein production, processing, distribution, and retail can be subject to different regulations.3
Note also that the regulatory jurisdiction need not fall entirely on one agency. Indeed, the overlapping framework may be intentional in an effort to mitigate regulatory loopholes and capture decentralized expertise. For example, in addition to regulation from the FDA, the aquaculture industry is regulated by the USDA, the Environmental Protection Agency, the National Oceanic and Atmospheric Administration, and the U.S. Fisheries and Wildlife Service (FAO, 2021b). These relationships among agencies are often leveraged to establish certification and food safety training programs, such as the Seafood Hazard Analysis and Critical Control Points (HACCP) Alliance (Association of Food and Drug Officials, 2021).
In addition to the decentralized structure of monitoring and enforcement, state and local legislators can pass laws on food policy provided that they do not interfere with interstate commerce (lest they be deemed unconstitutional) (Fortin, 2017; Sumner, 2017). As such, food establishments—whether involved in the production, processing, distribution, or retailing—must have a rich understanding of the federal, state, and local laws constraining their operation. With respect to aquaculture, this decentralized process is unique relative to other developed nations with comprehensive aquaculture industries, such as Norway, which has a centralized approach that was built to streamline the aquaculture licensing and permitting process (Engle and Stone, 2013).
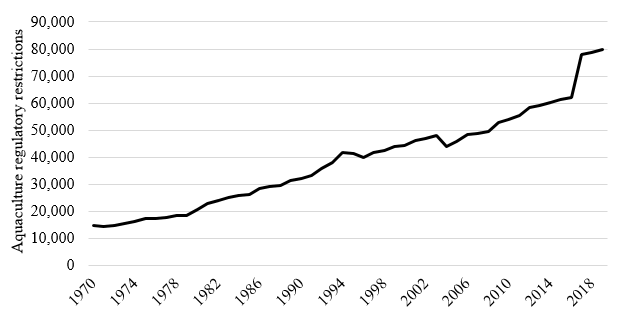
Note: The graph presents direct and indirect aquaculture
regulatory restrictions for NAICS 1125 (Aquaculture). The four-
digit industry code “comprises establishments primarily
engaged in the farm raising and production of aquatic animals
or plants in controlled or selected aquatic environments” (Office
of Management and Budget, 2017). The figure does not include
regulatory restrictions across processing, wholesale
distribution, or retail sales.
Table 1. Aquaculture Supply Chain Regulatory Restrictions from 1970–2019
| Year | 1970 | 1979 | 1989 | 1999 | 2009 | 2019 | |
| Aquaculture (NAICS 1125) |
Direct | 6,852 | 8,276 | 17,240 | 24,902 | 32,435 | 48,843 |
| Indirect | 7,711 | 10,149 | 13,958 | 19,035 | 20,331 | 30,930 | |
| Total | 14,563 | 18,425 | 31,198 | 43,936 | 52,766 | 79,773 | |
| Processing (NAICS 3117) |
Direct | 1,330 | 1,573 | 1,625 | 2,040 | 2,629 | 3,815 |
| Indirect | 3,525 | 5,650 | 8,176 | 10,660 | 12,011 | 15,422 | |
| Total | 4,855 | 7,223 | 9,802 | 12,700 | 14,640 | 19,237 | |
| Wholesale Distribution (NAICS 4244) |
Direct | 555 | 1,130 | 2,235 | 2,648 | 4,612 | 5,027 |
| Indirect | 5,175 | 10,763 | 15,954 | 19,011 | 21,948 | 26,704 | |
| Total | 5,730 | 11,893 | 18,189 | 21,659 | 26,560 | 31,732 | |
| Retail sales (NAICS 4451) |
Direct | 3,034 | 3,904 | 5,521 | 7,220 | 7,896 | 11,839 |
| Indirect | 5,099 | 10,087 | 14,963 | 17,816 | 20,253 | 26,903 | |
| Total | 8,133 | 13,991 | 20,483 | 25,037 | 28,149 | 38,742 | |
| Total Regulatory Restrictions | 33,281 | 51,532 | 79,670 | 103,332 | 122,116 | 169,484 | |
Notes: Aquaculture was modeled using NAICS sector 1125 (Aquaculture); Processing used NAICS sectors
3117 (Seafood Product Preparation and Packaging); Wholesale distribution used NAICS sector 4244
(Grocery Wholesalers); and Retail Sales used NAICS sector 4451 (Grocery Stores).
Figure 2 presents regulatory restrictions relating specifically to aquaculture production (NAICS 1125) over the past 50 years, while Table 1 presents a decade-by-decade analysis of the regulatory restrictions across the entire supply chain: aquaculture production (NAICS 1125) à processing (NAICS 3117) à wholesale distribution (NAICS 4244) à retailer (NAICS 4451). Our approach allows us to estimate the total number of direct and indirect regulatory constraints in each sector. For our purposes, direct regulatory restrictions refer to constraints that bind the aquaculture producer, processor, wholesale distributor, or retailer themselves, while indirect regulatory restrictions are constraints that affect the inputs of each individual segment of the aquaculture supply chain.4
Since 1970, aquaculture supply chain regulatory constraints have increased by approximately 400%. The aquaculture supply chain is now subject to nearly 170,000 regulatory restrictions, with the majority of growth coming from constraints imposed on the production stage of the supply chain (NAICS 1125). Regulatory restrictions imposed on the production of aquaculture now account for 47% of all aquaculture supply chain regulatory restrictions, while processing, wholesale distribution, and retail sales account for the remaining 11%, 19%, and 23% of restrictions, respectively. Importantly, the growth in regulatory restrictions on aquaculture production has largely been through increased direct regulatory constraints. From 1970 to 2019, the percentage of direct regulations in aquaculture production (NAICS 1125) increased from 47% to 61%. In other words, while both direct and indirect regulatory restrictions have increased over time, a larger share of the recent regulatory language may have affected the actions and behaviors of the producer or production facility (direct restrictions) compared to the inputs to production (indirect restrictions).
There are several potential explanations for the increase in total aquaculture supply chain regulatory constraints. First, an increasing body of federal law and complex, interconnected global economy could explain the growth in regulatory restrictions. Indeed, during this time frame, the Obama administration passed the Food Safety Modernization Act (FSMA) of 2011. The FSMA is considered to be the most significant piece of food law reform since the establishment of the FD&C Act of 1938 (Fortin, 2017). Comprised of seven key rules, the FSMA of 2011 addressed issues of sanitation, adulteration, voluntary third-party certification programs, etc. (Thatte, 2019). Calling attention to Figure 2, we see that aquaculture production experienced a 26% year-over-year (YoY) increase in regulatory restrictions from 2016 to 2017. Over the 50-year period analyzed here, the 26% YoY change from 2016 to 2017 represents the largest shift in regulatory burden on the industry, with the second largest YoY change being a 12% increase from 1979 to 1980. The 26% increase in regulatory restrictions for aquaculture production in 2017 aligns with the codification of two key FSMA rules with implications on protein production: Mitigation Strategies to Protect Food Against Intentional Adulteration (21 CFR 11; 21 CFR 121, Food and Drug Administration, 2016a) and Sanitary Transportation of Human and Animal Food (21 CFR 1; 21 CFR 11, Food and Drug Administration, 2016b). This fact lends credence to the methodology employed while simultaneously demonstrating how large-scale legislative reform transform the regulatory landscape for an entire sector of the economy. Indeed, Staples et al. (2021) report that all protein sources (cattle, hog and pig, poultry, goat and sheep, aquaculture, and other animals) saw approximately a 25% YoY increase in regulatory restrictions from 2016 to 2017.
Second, the literature suggests that stringent U.S. aquaculture regulatory frameworks are often imposed due to concerns regarding effluent discharge and waste disposal (Boyd, 2003; Engle, van Senten, and Fornshell, 2019; van Senten et al., 2020). The discharge of excess nutrients, antibiotics, and organic fecal waste from fish production pose undesirable challenges to the environment (Read and Fernandes, 2003). As such, recent environmental policy—particularly related to water quality—may disproportionately impact the aquaculture industry relative to other protein producers. Maintaining premium water quality through water and waste management strategies can be expensive for the producer (Engle and Valderrama, 2002; Engle and Stone, 2013; Ahmad et al., 2021).
Finally, disease propagation from farmed aquatic animals to wild species through either water discharge or escapements is also a concern. Interaction between farmed fish and wild stocks can result in potential genetic dilution and the spread of disease from the former to the latter (Wirth and Luzar, 1999; Noga, 2010). Bacteria resistance through the widespread use of antibiotics in fish production can also damage wild fish stocks if the necessary precautions are not taken to limit escapements. Anxieties over food safety and fish health have also induced agencies to limit the availability of veterinary products in aquaculture production (Engle and Stone, 2013). For this reason, U.S. aquaculture producers face additional costs securing vital antibiotics and pharmaceutical products to control the spread of aquaculture-related diseases, making it difficult for them to compete with farmers in developing countries where the use of antibiotics is unregulated. Producers not only control disease outbreaks, but they must also have their fish sampled and water tested to conform to regulatory policies, leading to costs in product, time, labor, and lab testing.
Concerns regarding burdensome regulation for aquaculture have been prominently highlighted in an emerging line of literature on the impact of regulatory structures on aquaculture growth (Engle and Stone, 2013; Abate, Nielsen, and Tveterås, 2016; Engle, 2016). While rigorous empirical studies are needed, preliminary evidence points toward the increasingly stringent regulatory environment impacting the profitability and growth of the aquaculture industry. For instance, Engle and Stone (2013) stressed that the stringency of the regulatory framework governing U.S. aquaculture has increased in recent times, both in number and complexity. The evolving regulatory framework has generated higher production costs (van Senten and Engle, 2017; Engle, van Senten, and Fornshell, 2019; van Senten et al., 2020), increased transaction costs from market participation (Engle and Stone, 2013; Knapp and Rubino, 2016; van Senten and Engle, 2017; Engle, van Senten, and Fornshell, 2019), and created stakeholder confusion and risk over enforcement and future regulatory barriers (Wirth and Luzar, 1999; Rioux, 2011; Osmundsen, Almklov, and Tveterås, 2017).
Federal laws are not the only constraints on the aquaculture supply chain. For example, several empirical studies have documented the costs of state-level aquaculture regulations on the industries’ overall growth and dynamism (van Senten and Engle, 2017; Engle, van Senten, and Fornshell, 2019; van Senten et. Al, 2020). Some such regulations include the ban on Atlantic Salmon production in net pens off the Washington coast and the ban on commercial finfish aquaculture production in Alaska (Knapp and Rubino, 2016; Anderson, Asche, and Garlock, 2019).
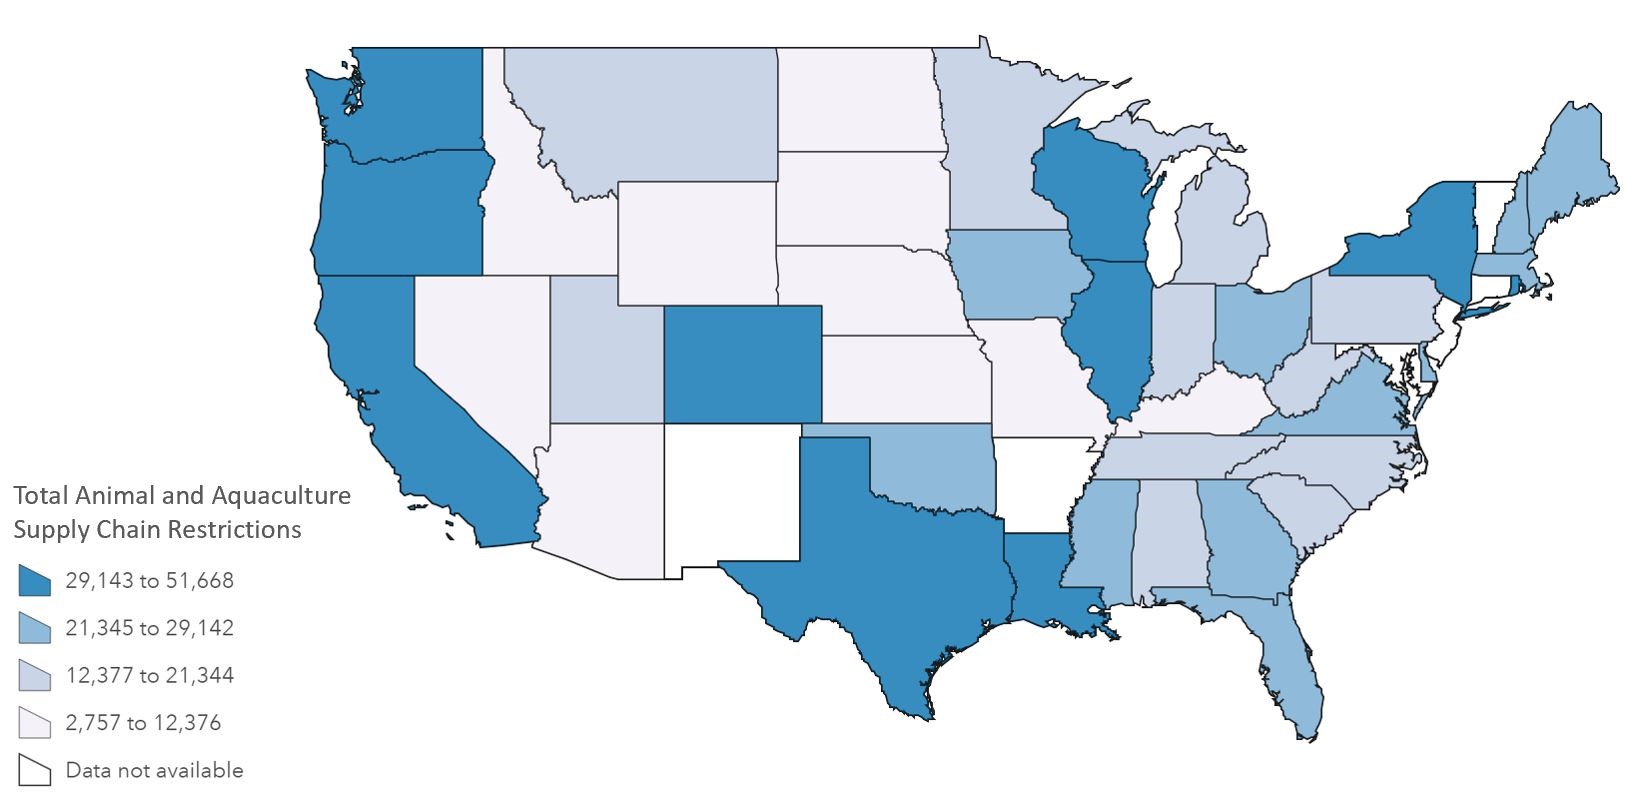
Figure 3 uses State RegData to estimate the number of regulatory restrictions imposed across animal and aquaculture supply chains (producer à processor à wholesale distribution à retailer) at the state level. Unfortunately, the data are limited to the three-digit NAICS level, so we present data from NAICS code 112 (Animal Production and Aquaculture).5 6 As such, the analysis speaks more to spatial heterogeneity in protein supply chain regulatory restrictions across states than to aquaculture supply chains itself.
State regulatory restrictions associated with animal and aquaculture supply chains range from 2,757 restrictions (South Dakota) to a high of 51,668 (California), with a mean of 21,817 and median of 20,589. Figure 3 suggests regulatory restrictions tend to be associated with the population size and the economic activity in a state, meaning that states with relatively large economies generally have more regulatory restrictions than smaller states (e.g., California versus Mississippi). Nevertheless, the figure also reveals large variation in regulatory restrictions at the state level demonstrating differences in the regulatory environment of protein supply chains across state lines. We do not find a clear pattern suggesting that states with more regulatory restrictions in animal production and aquaculture tend to have less aquaculture production. In fact, of the top-five leading aquaculture producers (Mississippi, Washington, Louisiana, Virginia, California) (Hyink and Melstrom, 2021), three (California, Washington, and Louisiana) were ranked among the top ten in total regulatory restrictions across the animal and aquaculture supply chain; Virginia (14th) and Mississippi (22nd) ranked in the top half. This is not to say that regulations have no bearing on production but instead that “over-burdened” likely hinges on the particulars of individual regulations rather than the number of overall restrictions. In other words, while the total number of regulatory constraints provides a proxy for regulatory burden, the restrictiveness of each regulation must be addressed in future studies.
Although additional empirical studies that causally isolate the impacts of aquaculture regulations are needed, there is substantial anecdotal and observational evidence that suggest an increasingly stringent regulatory environment for aquaculture operations in the United States. Could more and relatively faster growth in regulatory restrictions explain the current sluggishness in U.S. aquaculture production? It depends. Between 1980 and 2016, U.S. aquaculture output increased 165%, from 168,000 tonnes to 445,000 tonnes (FAO, 2021a). This is faster than some animal industries—including cattle, which increased 25% between 1970 and 2018 (USDA, 2021)—but slower than others, including poultry, which increased nearly 500% between 1960 and 2006 (MacDonald, 2008). Further, while some countries have experienced unprecedented growth in their aquaculture production volumes, U.S. aquaculture production peaked in 2004 at 600,000 tonnes (FAO, 2021a); environmental regulatory restrictions are commonly cited as a limiting factor to the industry’s development (Engle and Stone, 2013; van Senten et al., 2020). As such, more work must be done on the qualitative components of aquaculture restrictions. That is, future studies should examine the restrictiveness and economic burden that a specific piece of legislation places on the aquaculture industry (e.g., legislation related to effluent discharge, water quality, or waste disposal).
The negative impacts caused by the COVID-19 pandemic have created an opportunity for policy makers and regulators to re-evaluate the regulatory environment for aquaculture farms (van Senten, Engle, and Smith, 2021). Indeed, the Trump administration signed Executive Order (EO) 13921 in May of 2020 to deregulate the aquaculture industry. By removing “outdated” regulatory barriers and streamlining the permitting process, EO 13921 seeks to expand production opportunities for the aquaculture industry (e.g., use of net pens in federal waters) (Douglas, 2020; Exec. Order No. 13921, 2020). Following its implementation, the USDA (2020) held a six-part virtual Aquaculture Is Agriculture Colloquium in which they engaged with stakeholders on a variety of topics, including environmental management, technological innovation, and marketing. In summarizing the colloquium and describing how the agency plans to assist the industry moving forward, the USDA (2020) writes,
The greatest constraints to the growth of U.S. aquaculture have been the inappropriate application of a regulatory environment designed for terrestrial agriculture and the lack of a comprehensive economic development plan. These constraints have prevented many segments of U.S. aquaculture from expanding to meet growing local demand for their products and competing effectively against imported products. In addition, some states regulate U.S. aquaculture using a framework designed for terrestrial agriculture, while other states regulate U.S. aquaculture using a framework designed for public-sector management of natural resources. Neither approach is useful for supporting or promoting the expansion of U.S. aquaculture (pg. 2).
Ultimately, food law remains complex, overlapping, and decentralized, and we hope this conversation can lend itself to further discussion on the current regulatory landscape of the aquaculture industry and spark ideas on potential mechanisms to grow the U.S. aquaculture industry.
Abate, T.G., R. Nielsen, and R. Tveterås. 2016. Stringency of Environmental Regulation and Aquaculture Growth: A Cross-Country Analysis. Aquaculture Economics & Management 20(2): 201–221.
Ahmad, A., S.R.S. Abdullah, H.A. Hasan, A.R. Othman, and N.I. Ismail. 2021. “Aquaculture Industry: Supply and Demand, Best Practices, Effluent and Its Current Issues and Treatment Technology.” Journal of Environmental Management 287: 112271.
Anderson, J.L., F. Asche, and T. Garlock. 2019. “Economics of Aquaculture Policy and Regulation.” Annual Review of Resource Economics 11: 101–123.
Alexander, K.A., T.P. Potts, S. Freeman, D. Israel, J. Johansen, D. Kletou, M. Meland, D. Pecorino, C. Rebours, M. Shorten, and D.L. Angel. 2015. “The Implications of Aquaculture Policy and Regulation for the Development of Integrated Multi-Trophic Aquaculture in Europe.” Aquaculture 443: 16–23.
Association of Food and Drug Officials. 2021. Seafood HACCP Alliance. Available online: https://www.afdo.org/training/sha/ [Accessed September 21, 2021].
Boyd, C.E. 2003. “Guidelines for Aquaculture Effluent Management at the Farm-Level.” Aquaculture 226(1–4): 101–112.
Chambers, D., C.A. Collins, and A. Krause. 2019. “How Do Federal Regulations Affect Consumer Prices? an Analysis of the Regressive Effects of Regulation.” Public Choice 180(1): 57–90.
Douglas, L. 2020, May 8. “Trump’s Executive Order Seeks Controversial Overhaul of Seafood Industry.” Food & Environment Reporting Network Available online: https://thefern.org/ 2020/05/trumps-executive-order-seeks-controversial-overhaul-of-seafood-industry/.
Engle, C.R. 2016. “Sustainable Growth of Aquaculture: The Need for Research to Evaluate the Impacts of Regulatory Frameworks.” Journal of the World Aquaculture Society 47(4): 461–463.
Engle, C.R., and N.M. Stone. 2013. “Competitiveness of US Aquaculture Within the Current US Regulatory Framework.” Aquaculture Economics & Management 17(3): 251–280.
Engle, C.R., J. van Senten, and G. Fornshell. 2019. “Regulatory Costs on US Salmonid Farms.” Journal of the World Aquaculture Society 50(3): 522–549.
Engle, C.R., and D. Valderrama. 2002. “The Economics of Environmental Impacts in the United States.” In J.R. Tomasso (ed.), Aquaculture and the Environment in the United States. Baton, Rouge, LA: U.S. Aquaculture Society, pp. 240–270.
Executive Office of the President. 2020, May 12. “Executive Order 13921: Promoting American Seafood Competitiveness and Economic Growth.” Federal Register 85: 28471–28477.
Food and Agriculture Organization of the United Nations. 2021a. FishstatJ – Software for Fishery and Aquaculture Statistical Time Series. Available online: http://www.fao.org/ fishery/statistics/software/fishstatj/en [Accessed September 21, 2021].
Food and Agriculture Organization of the United Nations. 2021b. National Aquaculture Legislation Overview: United States of America. Available online: http://www.fao.org/fishery/legalframework/nalo_usa/en [Accessed September 21, 2021].
Food and Drug and Administration. 2016a. “Mitigation Strategies to Protect Food against Intentional Adulteration: 21 CFR 11; 21 CFR 121.” Federal Register 81: 34165–34223.
Food and Drug and Administration. 2016b. “Sanitary Transportation of Human and Animal Food: 21 CFR 1; 21 CFR 11.” Federal Register 81: 34165–34223.
Fortin, N. 2017. “Introduction to Food Regulation.” In N. Fortin (ed.), Food Regulation: Law, Science, Policy, and Practice. Hoboken, NJ: Wiley, pp. 3–20.
Hyink, J., and R. Melstrom. 2021. Summary of Aquaculture in the United States. Chicago, IL: Loyola University Chicago Institute of Environmental Sustainability ENVS-2201-01.
Knapp, G., and M.C. Rubino. 2016. The Political Economics of Marine Aquaculture in the United States. Reviews in Fisheries Science & Aquaculture 24(3): 213–229.
MacDonald, J. 2008. The Economic Organization of U.S. Broiler Production. U.S. Department of Agriculture, Economic Research Service, Economic Information Bulletin EIB-38.
Malone, T., and D. Chambers. 2017. “Quantifying Federal Regulatory Burdens in the Beer Value Chain.” Agribusiness 33(3): 466–471.
Malone, T., and J.L. Lusk. (2016). “Brewing Up Entrepreneurship: Government Intervention in Beer.” Journal of Entrepreneurship and Public Policy 5(3): 325–342.
McLaughlin, P.A., and O. Sherouse. 2019. “Regdata 2.2: A Panel Dataset on US Federal Regulations.” Public Choice 180(1): 43–55.
Mullally, C., and J.L. Lusk. 2018. “The Impact of Farm Animal Housing Restrictions on Egg Prices, Consumer Welfare, and Production in California.” American Journal of Agricultural Economics 100(3) 649–669.
Noga, E.J., ed. 2010. Fish Diseases: Diagnosis and Treatment, 2nd ed. Ames, IA: Wiley-Blackwell.
Office of Management and Budget. 2017. North American Industry Classification System, 2017. Available online: https://www.census.gov/naics/reference_files_tools/2017_NAICS_Manual.pdf [Accessed September 21, 2021].
Osmundsen, T.C., P. Almklov, and R. Tveterås. 2017. “Fish Farmers and Regulators Coping with the Wickedness of Aquaculture.” Aquaculture Economics & Management 21(1) 163–183.
Read, P., and T. Fernandes. 2003. “Management of Environmental Impacts of Marine Aquaculture in Europe.” Aquaculture 226(1–4): 139–163.
Rioux, D. 2011. “United States Shellfish Growers Perception of Risk.” In R. Stickney, R. Iwamoto, and M. Rust (eds.) Interactions of Fisheries and Fishing Communities Related to Aquaculture: Proceedings of the Thirty-Eighth U.S.-Japan Aquaculture Panel Symposium. Silver Spring, MD: U.S. Department of Commerce, National Oceanic and Atmospheric Administration, pp. 10–20.
Staples, AJ., D. Chambers, and T. Malone. 2021. “How Many Regulations Does It Take to Get a Beer? The Geography of Beer Regulations.” Regulation & Governance.
Staples, A.J., D. Chambers, R.T. Melstrom, and T. Malone. 2021. “Regulatory Restrictions across U.S. Protein Supply Chains.” Journal of Agricultural and Applied Economics.
Sumner, D.A. 2017. “Economics of US State and Local Regulation of Farm Practices, with Emphasis on Restrictions of Interstate Trade.” Annual Review of Resource Economics 9: 13–31.
Thatte, D. 2019, October 17. “The Food Safety Modernization Act in a Nutshell.” Manufacturing Innovation Blog. Available online: https://www.nist.gov/blogs/manufacturing-innovation-blog/food-safety-modernization-act-nutshell.
U.S. Department of Agriculture. 2019. Food Availability (Per Capita) Data System: Red Meat, Poultry, and Fish. Washington, DC: U.S. Department of Agriculture, Economic Research Service. Available online: https://www.ers.usda.gov/data-products/food-availability-per-capita-data-system/ [Accessed September 21, 2021].
U.S. Department of Agriculture. 2020. Aquaculture Is Agriculture Colloquium: USDA’s Role in Supporting the Farmers of Fish, Shellfish, and Aquatic Plants. Washington, DC: U.S. Department of Agriculture. Available online: https://www.usda.gov/sites/default/files/ documents/aquaculture-agriculture-colloquim.pdf.
U.S. Department of Agriculture. 2021. Since 1970, Increasing Cattle Weights Have Fueled Growth of U.S. Beef Production as Cattle Used Have Decreased. Washington, DC: U.S. Department of Agriculture. Available online: : https://www.ers.usda.gov/data-products/chart-gallery/gallery/chart-detail/?chartid=93225 [Accessed September 21, 2021].
van Senten, J., and C.R. Engle. 2017. “The Costs of Regulations on US Baitfish and Sportfish Producers.” Journal of the World Aquaculture Society 48(3): 503–517.
van Senten, J., C.R. Engle, B. Hudson, and F.S. Conte. 2020. “Regulatory Costs on Pacific Coast Shellfish Farms.” Aquaculture Economics & Management 24(4): 447–479.
van Senten, J., C.R. Engle, and M.A. Smith. 2021. “Effects of COVID-19 on US Aquaculture Farms.” Applied Economic Perspectives and Policy 43(1): 355–367.
Wirth, F.F., and E.J. Luzar. 1999. “Environmental Management of the US Aquaculture Industry: Insights from a National Survey.” Society & Natural Resources 12(7): 659–672.
1 For more information on the evolution of U.S. food law, see Fortin (2017).
2 For details on the methodology of calculating measures of regulatory restrictions, see McLaughlin and Sherouse (2019).
3 For instance, amendments made to the FD&C Act will directly affect the aquaculture industry but will not directly affect the other meat industries; amendments made to USDA-FSIS policies (e.g., via the Federal Meat Inspection Act) will affect the beef, pork, and/or poultry industries but will not directly affect the aquaculture industry.
4 Indirect regulatory restrictions are calculated using input–output commodity weights from the Bureau of Economic Analysis (BEA) to weight the regulatory restrictions that apply to each. industry that produces the inputs required by that industry’s supply chain. For further discussion of the construction of direct and indirect regulatory restrictions, see Malone and Chambers (2017); Chambers, Collins, and Krause (2019); and Staples, Chambers, and Malone (2021).
5 Using the three-digit NAICS code 112 implies that our measure for the production stage of the supply chain now includes cattle ranching (NAICS 1121), hog and pig farming (NAICS 1122), poultry and egg production (NAICS 1123), sheep and goat farming (NAICS 1124), aquaculture (NAICS 1125), and other animal production (NAICS 1129).
6 All stages of the animal and aquaculture supply chains are aggregated at the three-digit level due to data limitations. We use NAICS 112: Animal Production and Aquaculture for production; NAICS 311: Food Manufacturing for processing; NAICS 424: Merchant Wholesalers, Nondurable Goods for wholesale distribution; and NAICS 445: Food and Beverage Stores for retail sales.

