The United States will become the fourth most populous country in 2050, with 379 million people, while the world population is expected to reach 10 billion people (United Nations, 2019). In this context, agricultural research has focused on discovering strategies to ensure food production can meet this increasing food demand. This study evaluated ongoing changes in social aspects of demand for seafood as a source of protein by identifying individuals’ preferences moved by the effect of interlinked scientific and technological development within boundaries of environmental sustainability on food production systems.
Seafood is a healthy source of animal protein, providing calcium and minerals, omega-3 and other beneficial fatty acids, and vitamins B12 and D (USDA and HHS, 2020). Seafood also has an environmental advantage in terms of resource use in relation to other animal protein production systems. With an efficient feed conversion rate (FCR), estimated as the proportion of feed intake by the weight gained by the animal, fish production has a lower environmental impact as less feed is required to produce a ton of fish (d’Orbcastel, Blancheton, and Aubin, 2009; Besson et al., 2014; Besson et al., 2016), between 1.0 and 2.4, compared to 6.0–10.0 in beef, 2.7–5.0 in pigs and 1.7–2.0 in chicken (Fry et al., 2018). This efficient FCR, along with high fertility rates, also contributes to a significantly lower greenhouse gas (GHG) emission intensity than ruminants, another important contribution of seafood aquaculture to environmental sustainability (MacLeod et al., 2020).
U.S. per capita seafood consumption is below the global average but has grown 25% since 1990, of which 10% happened in the last decade (National Marine Fisheries Service, 2021; USDA, 2021). Market reports credit this growing demand for seafood to consumers’ increasing consciousness of the benefits of eating a healthier diet (Roberts, 2021). Although market researchers attribute the large increase in U.S. retail sales of seafood in 2020 to the closure of restaurants during the COVID-19 pandemic, sales have been steadily increasing for years. Retail sales grew from $14 billion in 2016 to $16 billion in 2019 and then soared to $19.8 billion in 2020 (Roberts, 2021). A major reason why consumers buy seafood is its perceived health benefit, especially compared to red meat; seafood is also considered tasty and a good source of protein (Murrary, Wolff, and Patterson, 2017; Averbook, 2018; Roberts, 2021).
Despite the potential increase in demand from market trends that favor seafood consumption, U.S. seafood production—both from fisheries and aquaculture—struggles to grow as it faces supply-chain driven challenges (Hull, 2005), high production costs (Engle, van Senten, and Fornshell, 2019), and lower market prices induced by international producers with lower production costs. The United States runs a large seafood trade deficit, importing from 70% to 85% of the seafood it consumes (Engle, Quagrainie, and Dey, 2017; National Marine Fisheries Service, 2021).
This study provides insights into the U.S. seafood consumer demand to inform the industry about opportunities to expand the share of domestically produced seafood consumption. First, preferences for specific species are drawn, including popular species encountered in retail and other Midwest-caught or produced species, which take a smaller share of current markets but are still part of the U.S. consumers’ culture and culinary tradition. Second, attitudes toward attributes and market claims which may benefit both fisheries and aquaculture industry are assessed. To that end, a nationwide online survey of U.S. seafood consumers was distributed in the fall of 2020, using Qualtrics. Though the demographics of the final sample skew younger, more White, and lower on the income spectrum than the national average, it is nationally representative.
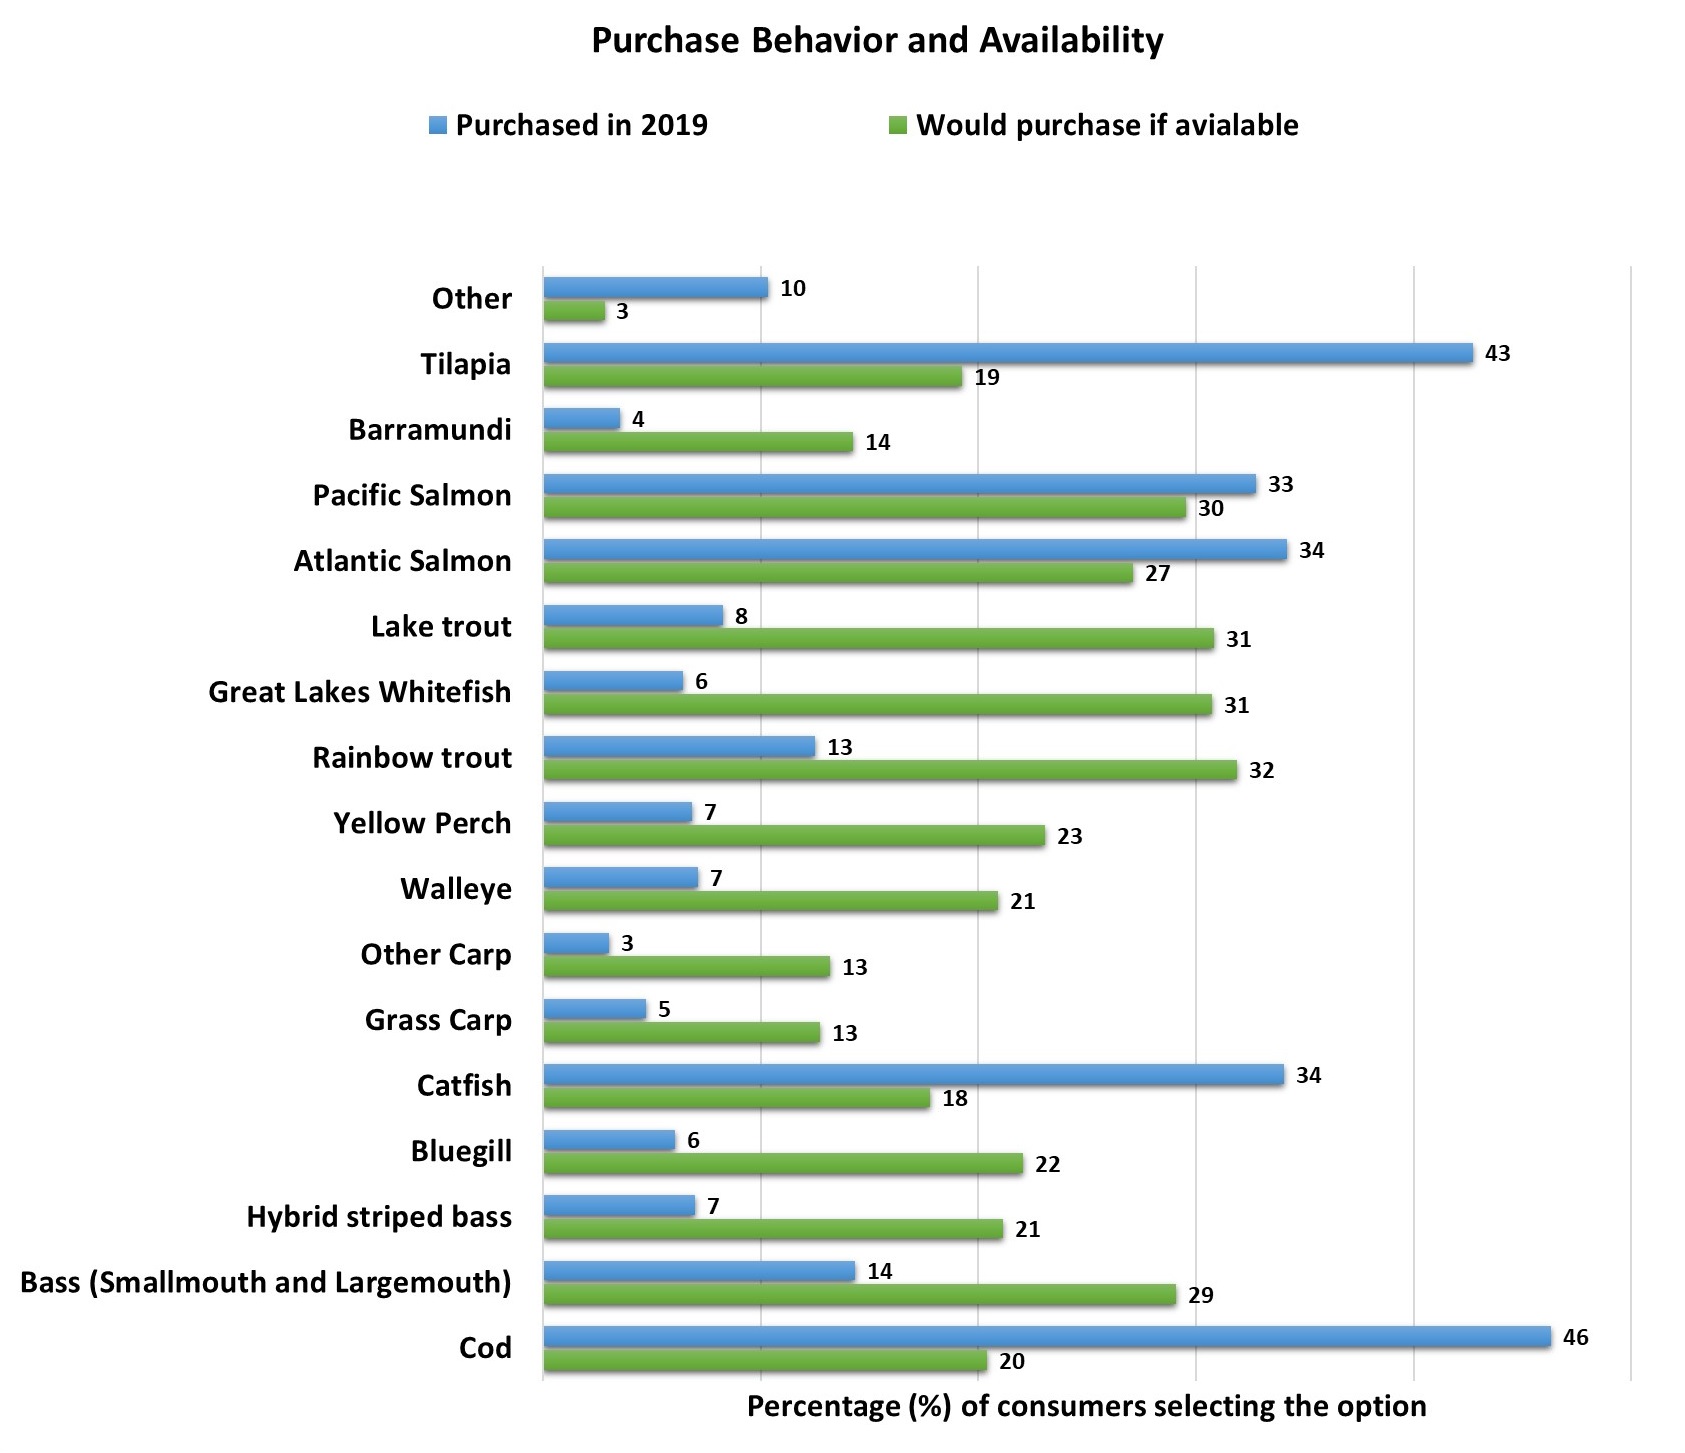
To elicit purchase behavior, consumers were first asked which species they purchased in 2019. Respondents chose from 16 species of finfish (Figure 1). Cod was the top ranked purchase, chosen by 46% of respondents, followed by tilapia (43%) and catfish (34%) and Atlantic salmon (34%). These results reflect the variety of species consumed but also emphasize that U.S. consumers of fish and seafood focus on only a few species (Shamshak et al., 2019). A second question explicitly asked what species consumers would have bought if all 16 listed species had been made available. An opportunity was identified here to expand smaller markets as consumers exhibited willingness to purchase Midwest species instead of tilapia, cod, or catfish if made available at their chosen market channel. Rainbow trout led the national list (Figure 1), as 32% of respondents requested the species, followed by the Great Lakes whitefish (31%), and lake trout (31%). Midwest-produced or caught species such as lake and rainbow trout, Great Lakes whitefish, yellow perch, walleye, and bluegill appear to have a greater demand than currently estimated by suppliers, indicating an underserved market for these species.
Restaurants are reportedly the primary outlet for seafood consumption in the United States, and those who order seafood at restaurants tend to have higher than average incomes (Engle, Quagrainie, and Dey, 2017; Love et al., 2020). In this study, 80% of respondents reported eating seafood both at home and away from home while equal proportions, 8%, ate seafood only at home or only in a restaurant. Individuals earning at least $75,000 were less likely to consume seafood at home, while those earning under $75,000 were less likely to eat seafood in a restaurant.
Traditional supermarkets served as the major outlet for seafood shoppers purchasing for home consumption, with 74% purchasing in store and 22% purchasing online or delivery sales. Seafood shoppers frequented mass merchandisers second as much, with 58% of those customers buying at the store and 16% choosing online and delivery. Given the growing trend in fisheries and aquaculture to seek direct-to-consumer sales, consumers were asked if they bought seafood from farmers’ markets or food subscription and delivery services. About a third (34%) reported patronizing farmers’ markets and 22% subscribed to such services.
The comparative lack of seafood consumption at home stems predominantly from perceived difficulty or uncertainty regarding seafood preparation but includes other factors such as the perceived expense of seafood or the smell of uncooked seafood, often associated with freshness of seafood. High prices observed in restaurants lead as the main reason respondents did not eat seafood in a restaurant.
| Forms of Product (average all species) |
Fish | Shellfish (crustaceans) |
Mollusks | |
| Sample selection (N = 1,416) | 99% | 77% | 37% | |
| Frozen | Whole | 27% | 61% | 36% |
| Fillets | 49% | — | — | |
| Breadeda | 24% | — | — | |
| Tails | — | 39% | — | |
| Fresh | Whole | 28% | 69% | 42% |
| Fillets | 48% | — | — | |
| Preparedb | 24% | — | — | |
| Tails | — | 31% | — | |
| Live | 2.2% | 3.8% | 10% | |
| Smoked | 2.4% | 2.9% | 7% | |
| Shelf stable (cans/pouches) | 1.7% | 2.4% | 6% | |
Notes: aFrozen breaded fish products include fish sticks or breaded fillets.
bFresh prepared fish products include marinated or seasoned fillets or portions.
Alternative forms of seafood were presented to respondents when asked about their past year purchases, including fresh, frozen, or live, with value-added options such as breaded, fresh prepared, or smoked. Overall, consumption of fish was larger than shellfish or mollusks in this study (Table 1). Similar proportions of respondents purchased fresh and frozen fish, possibly reflecting consumers’ acceptance of new flash-freezing technologies. Of the individuals who bought fish, 49% of respondents purchased frozen fillets and 48% purchased fresh fillets. Only 24% of respondents purchased a value-added option of either “frozen and breaded” or “fresh and prepared” fish, showing a preference for less value-added products (Surathkal et al., 2017). A clear preference for fresh was observed between individuals who bought shellfish, with 69% of respondents purchasing fresh and 61% of respondents purchasing frozen whole shellfish. In the case of shellfish sold as tails, frozen was purchased by 39% of respondents while 31% of respondents purchased fresh tails. Mollusks are also purchased fresh more frequently than frozen. Value-added options such as smoked or shelf stable, the least popular choice, represented less than 3% of their purchases.
When asked whether the seafood they bought was farm-raised or wild-caught, on average per species, a third of mollusks and shellfish consumers and a quarter of individuals who had bought finfish were uncertain. The percentage of consumers’ wild-caught purchasing choice were consistently higher than farm-raised for all mollusks and shellfish, with an average between all species of 43% and 45%, respectively, compared with 25% of farmed mollusks and shellfish. The scenario for fish-purchasing choices differs between species. Hybrid striped bass, grass carp, and barramundi were more frequently chosen with the understanding that these are farm-raised. Cod, Pacific and Atlantic salmon, and walleye were bought as wild-caught almost twice as much as farm-raised, but a third of respondents were unsure, which could express indifference toward the production system, especially cod consumers (37%). Yellow perch, rainbow trout, bass (including smallmouth and largemouth), lake trout, and bluegill purchased by consumers were predominately wild-caught by about 10% more than farm-raised. Only a fifth to a quarter of respondents were uncertain about production systems for these species. Highest uncertainty, and possible indifference, was observed for tilapia (41%).
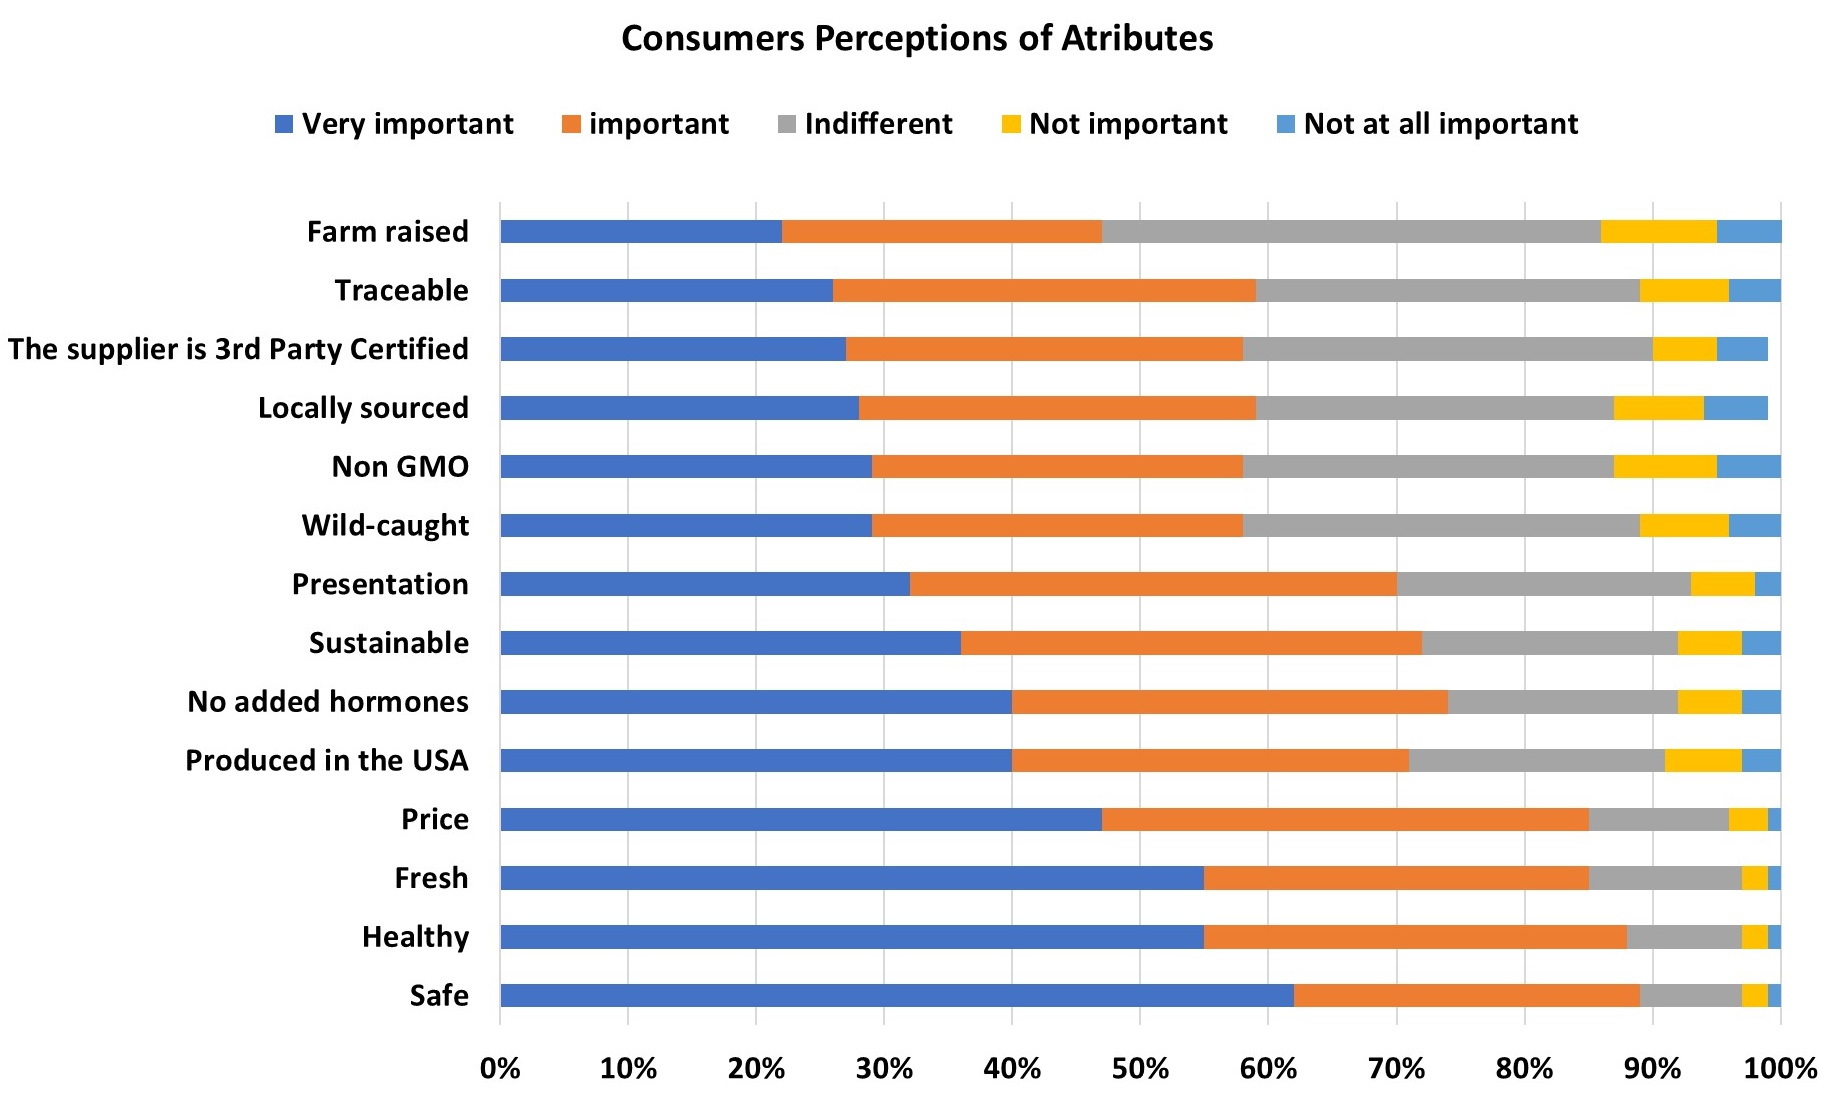
Questions were designed in this study to not only identify consumers perceptions regarding attributes of seafood but also to untangle preferences between attributes (Figure 2). In particular, the question “How important are these attributes for you when choosing seafood?” was asked twice with two sets of attributes, combined to measure the importance consumers ascribe to labels of “wild-caught,” “farm-raised,” “3rd party certification,” “non GMO,” “no added hormones,” “safe,” and “presentation,” separately from their personal values attributed to “fresh,” “healthy,” “sustainable,” “produced in the USA,” “locally sourced,” “traceable,” and how important “price” is when purchasing seafood.
At an aggregated level, consumers showed awareness about the importance of food safety guaranteed by a regulatory system they trust, along with maintaining a healthy diet and freshness. Specifically, 62% of participants ranked “safe” as a “very important” attribute when purchasing seafood. “Healthy” and “fresh” ranked second, each rated “very important” by 55% of respondents, but “healthy” had a small edge of 3% in “important” over “fresh.” Next comes “price,” with 47% selecting “very important.” Another significant result unveiled here was the portion of individuals selecting U.S. production as “very important” (40%) or “important” (31%) when choosing seafood products. This may indicate the trust consumers place on American food safety control systems and institutions. “Farm-raised” was the least important attribute, with 22% choosing the “very important” options and also recorded the higher score of indifference to the claim, 39%, and the highest score for combined “not important” and “not important at all,” 14%. Less than 30% selected “very important” for “wild-caught” and “non-GMO” labels, as well as “locally sourced,” “supplier having a 3rd party certification,” and “traceable.”
A detailed look into demographics shows contrasting preferences between ethnic groups, gender, age, and household income levels.
Food safety was overall the most important attribute to all respondents, but particularly “very important” to women, Hispanic consumers, respondents earning between $25,000 and $50,000, and those 55–64 years old.
Healthy, the second most important attribute overall, ranked most important to the highest income bracket of “$150,000 or more,” individuals between 45 and 54 years old, and all ethnic groups, but more so to Hispanic and Black respondents.
Fresh is “very important” to consumers who are 45–54 years old and those in the highest income bracket, although lower-level income earners also find it “important” when choosing seafood. Respondents from all ethnic groups find freshness very important.
Price of seafood is a concern for most respondents, although the proportion of individuals indifferent or declaring price to be “not important” or “not important at all” increases as age decreases. About 2% more of women find price very important compared to men. Like freshness, price was very important to highest income earners. Within the ethnic groups, 54% of Hispanic respondents find “price” very important compared to lower levels of importance by Asian (43%) and Native American (33%) consumers.
Produced in the USA and locally sourced: Although an important attribute for some consumers (Fonner and Sylvia, 2014; Murray, Wolff, and Patterson, 2017), “localness” is neither well-defined nor well understood. To disentangle consumers’ perceptions toward local production from the trust associated with U.S. production, both market claims appeared on the same question. Overall, an excess of 10% valued the latter more. “Produced in the USA” was mostly considered very important by Black (48%) and Hispanic (42%) respondents. The youngest adults sampled, 18-to-24-year-olds, showed the highest level of indifference of any age group toward U.S. production. Opportunities to grow these segments include informing the public about the regulatory frameworks and how these institutions guarantee safe food for consumers. Locally sourced, on the other hand, is very important for Black (36%) and White (28%) consumers. Youngsters share a similarly high indifference to locally sourced claims (34%) with those aged 65 and higher (34%). Lower income earners place more value on the claim “produced in the USA,” while higher income earners value “locally sourced” claims more.
No added hormones claims resonated more with females, those in the 45–64 age bracket, higher income earners, and Black and Hispanic, but were least important to Native American respondents, about a third of 18-to-24-year-olds, those earning less than $25,000, and men.
Sustainable and third-party certification: Sustainable production is very important to almost 40% of individuals aged 35–44 and 45–54; men; individuals of Hispanic, Black, and White ethnicities and to half of those earning more than $150,000. These are also the groups that valued products with a third-party certification the most, although Black consumers, high income earners, and 35-to-44-year-olds rely more on the certification label than other ethnic groups.
Presentation was more important to females and to about 40% of high-income earners, people aged 35–44, and those within the Hispanic and Black ethnic groups. A higher combination of indifference and no importance was shown by lower income earners, both the youngest and the oldest groups, and the Native American and Asian groups.
Non-GMO was relatively unpopular in this sample but was of increasing importance as age increased up to 64 years old and more important as income increased. Women found the claim more important than men and among ethnic groups, about a third of Hispanic, Black, and Native American respondents found the non-GMO claim to be very important.
Traceable is a relatively new term to consumers, as processors have only recently made the feature available, which may explain the low importance given by consumers to an ability of track the source of their seafood. Only about a third of sampled consumers, predominantly 45-to-64-year-olds, high-income earners, and men, found it very important to be able to trace their seafood through the supply chain.
Wild-caught and farm-raised: Consumers attributed the least importance to claims of farm-raised and wild-caught production, with large segments reporting indifference or a lack of importance from production system labels. A small indifference to the farm-raised label was reported by the highest income earners and the highest by those age 65 years old or older. Although a third of 35-to-44-year-olds, very high-income earners, men, and Asian and Black consumers found it very important that their seafood be farm-raised. The youngest were indifferent about both farm-raised and wild-caught claims. Half of very high-income earners and about a third of male and individuals aged 35–44 found it very important that their seafood to be wild caught. Among ethnic groups, Native Americans and Hispanics valued most wild-caught as a characteristic of their seafood.
Worldwide, research focuses on sustaining sufficient supply of nutritious food to a fast-growing population. Fish emerges as an efficient use of resources in production of animal protein given its efficient feed conversion ratio (FCR) and low greenhouse gas (GHG) emission intensity compared to other sources of protein. Growing consumer awareness regarding nutritional value and health attributes of seafood, acceptance of new seafood preservation technologies, and increasing trust in environmental responsibility and food safety standards have contributed to a sharp increase in per capita seafood consumption worldwide. These trends are also observed in the United States, where consumption per capita has grown quickly. Despite its potential to expand, the U.S. seafood industry remains a commodity business with low profit margins. Consequently, demand is met through imports. This study aimed to identify demand for domestically produced and culturally important species and highlighted current market trends that favor attributes of seafood to offer opportunities to expand current markets.
Three main opportunities for the industry were identified in this study: to target underserved markets for species traditionally raised or caught in the North Central region, such as lake and rainbow trout, Great Lakes whitefish, yellow perch, walleye, and bluegill; to design labels with detailed information about food safety measures taken in production and healthy contents of their product; and to target fresh fillet markets while effectively operating the supply chain to access additional markets. An opportunity for the small-scale producer is to target least-offered species that are still sought by consumers, possibly through specialty seafood outlets and adopting alternative marketing mechanisms, such as the development of processing facilities for distributing high valued (demand-driven) direct-to-consumer seafood.
Averbook, M. 2018. Fish and Shellfish, US – November 2018. Mintel Group.
Besson, M., H. Komen, J. Aubin, I.J.M. de Boer, M. Poelman, E. Quillet, C. Vancoillie, M. Vandeputte, and J.A.M. van Arendonk. 2014. “Economic Values of Growth and Feed Efficiency for Fish Farming in Recirculating Aquaculture System with Density and Nitrogen Output Limitations: A Case Study with African Catfish (Clarias gariepinus)”. Journal of Animal Science 92(12): 5394–5405.
Besson, M., J. Aubin, H. Komen, M. Poelman, E. Quillet, M. Vandeputte, J.A.M. van Arendonk, and I.J.M. de Boer. 2016. “Environmental Impacts of Genetic Improvement of Growth Rate and Feed Conversion Ratio in Fish Farming under Rearing Density and Nitrogen Output Limitations.” Journal of Cleaner Production 116: 100–109.
d’Orbcastel, E.R., J-P. Blancheton, and J. Aubin. 2009. “Toward Environmentally Sustainable Aquaculture: Comparison between Two Trout Farming Systems Using Life Cycle Assessment.” Aquacultural Engineering 40(3): 113–119.
Engle, C.R., K.K. Quagrainie, and M.M. Dey. 2017. Seafood and Aquaculture Marketing Handbook, 2nd ed. Hoboken, NJ: Wiley-Blackwell.
Engle, C.R., J. van Senten, and G. Fornshell. 2019. “Regulatory Costs on U.S. Salmonid Farms.” Journal of the World Aquaculture Society 50: 522–549.
Fonner, R., and G. Sylvia. 2014. “Willingness to Pay for Multiple Seafood Labels in a Niche Market.” Marine Resource Economics 30(1): 51–70.
Fry, J.P., N.A. Mailloux, D.C. Love, M.C. Milli, and L. Cao. 2018. “Feed Conversion Efficiency in Aquaculture: Do We Measure It Correctly?” Environmental Resource Letters 13: 024017.
Hull, B.Z. 2005. “Are supply (driven) chains forgotten?”, International Journal of Logistics Management, The, 16(2): 218-236.
Love, D.C., F. Asche, Z. Conrad, R. Young, J. Harding, E.M. Nussbaumer, A.L. Thorne-Lyman, and R. Neff. 2020. “Food Sources and Expenditures for Seafood in the United States.” Nutrients 12(6): 1810.
MacLeod, M.J., M.R. Hasan, D.H.F. Robb, and M. Mamun-Ur-Rashid. 2020. “Quantifying Greenhouse Gas Emissions from Global Aquaculture.” Scientific Reports 10: 11679.
Murray, G., K. Wolff, and M. Patterson. 2017. “Why Eat Fish? Factors Influencing Seafood Consumer Choices in British Columbia, Canada.” Ocean & Coastal Management 144: 16–22.
National Marine Fisheries Service. 2021. Fisheries of the United States, 2019. Washington, DC: U.S. Department of Commerce, NOAA Current Fishery Statistics No. 2019.
Roberts, W. Jr. 2021. Fish and Shellfish, US – February 2021. Mintel Group.
Shamshak, G.L., J.L. Anderson, F. Asche, T. Garlock, and D.C. Love. 2019. “US Seafood Consumption.” Journal of the World Aquaculture Society 50: 715–727.
Surathkal, P., M.M. Dey, C.R. Engle, B. Chidmi, and K. Singh. 2017. “Consumer Demand for Frozen Seafood Product Categories in the United States.” Aquaculture Economics & Management 21(1): 9–24.
U.S. Department of Agriculture and U.S. Department of Health and Human Services (USDA and HHS). 2020. Dietary Guidelines for Americans, 2020-2025, 9th ed. Available online: http://www.dietaryguidelines.gov.
U.S. Department of Agriculture, Economic Research Service (USDA-ERS). 2021. Food Availability (Per Capita) Data System, by Linda Kantor and Andrzej Blazejczyk. Available online: https://www.ers.usda.gov/data-products/food-availability-per-capita-data-system/.
United Nations. 2019. World Population Prospects 2019: Highlights. United Nations, Department of Economic and Social Affairs, Population Division ST/ESA/SER.A/423.

