COVID-19 caused significant disruptions in food supply chains and altered consumer buying behavior. The impacts of COVID-19, most notably in the restaurant and food service sectors, are still being realized in food markets months after the initial shutdown. COVID-19 is a unique event with idiosyncratic effects on food consumption. Nonetheless, there are likely longer-term effects of the pandemic that are perhaps more predictable. The pandemic has caused a recession and spike in unemployment during the first quarter of 2020 (NBER, 2021), and there is much that has been learned about consumer food spending and buying behaviors during prior economic downturns that can be leveraged to gain insights about consumer food spending during the pandemic.
There are many differences between the present pandemic-induced recession and the Great Recession, which was associated with a deterioration of the housing market. The Great Recession’s impacts on food spending operated almost exclusively through changes in income and unemployment, whereas the COVID-19 impacts on food spending include these channels and more, including consumer demand shocks (increase in demand for food at grocery and reduction in demand for food away from home) and supply shocks (regulations affected the supply of food service options and temporary slowdown in meat processing from worker illnesses). Additionally, government support during the pandemic actually caused aggregate personal income to increase (FRED, 2021a), and along with a fall in spending on entertainment and travel, aggregate savings rates to increases as well (FRED, 2021b), although the effects are highly heterogeneous across households (Chetty et al., 2020). Despite these differences, understanding the impacts of changes in income, unemployment, and time availability that accompany recessions remains relevant to the current environment.
Economists’ understanding of the relationship between consumers’ food spending and income stems from the work of nineteenth-century German statistician Ernst Engel. The so-called Engel curve relates the share of spending on a good to a consumers’ income. For food, the relationship between income and food is so strong and consistent across countries and across peoples within a country that it has been deemed “Engel’s Law.” Engel’s Law asserts that consumers with higher incomes spend a smaller share of their income on food than lower-income consumers. This relationship implies that food is a so-called economic necessity, with food spending rising less than proportionally with increases in income. The implication is that a recession or loss of income will increase the importance of food in consumers’ overall budget.
Whether and to what extent consumption of particular foods increases or decreases with income is a matter of some debate in the literature. Most prior research suggests that food consumption in most categories increases with income, but in many cases, there is little relationship between the two (e.g., Beatty and LaFrance, 2005; Nelson et al., 2017; Ferrier, Zhen, and Bovay, 2018). Differences in periods studied, the way foods are categorized, and the statistical methods used make it difficult to compare income-consumption relationships across previous studies. As a result, we turn to data reported by the Bureau of Labor Statistics that stems from their annual Consumer Expenditure Survey (U.S. Bureau of Labor Statistics, 2020). We explore spending patterns of households averaged across the five most recent of years available (2015–2019) for five quintiles of income before taxes. Expenditures and incomes are adjusted for inflation using the consumer price index, and reported data are in 2019 dollars.
Table 1 shows the differences in spending patterns for different food items for households at different income levels. As incomes rise, households spend more on both food at home (FAH) and food away from home (FAFH). For example, for total food spending across FAH and FAFH, the highest-income households spent $13,574/year, whereas the lowest-income households only spent about $4,201/year on average over 2015–2019. Despite the fact that higher-income households spend more income on food, their food spending as a share of income is smaller than that of lower-income households, a finding consistent with Engel’s Law. For example, the highest-income households only spend about 6.6% of their income on all food, whereas the lowest income households spend 35.4% of their income on food. Engle’s Law holds for both FAH and FAFH, but the decline in spending on food with increased income is much steeper for FAH (i.e., food bought at a grocery store) than for FAFH (i.e., food at restaurants). The lowest income households spend 35% of their food budget on FAFH ([$1,481/$4,201] x 100%), whereas the highest income households spend almost 50% of their food budget on FAFH ([$6,684/$13,574] x 100%).
Table 1 also shows the FAH budget allocated to specific food items (unfortunately, there are no spending data for specific FAFH items). For some items (i.e., fats and oils, sugar and sweets, fresh fruit, and fresh vegetables), the FAH budget share increases with income. By contrast, the FAH budget share falls with income for other foods (i.e., beef, pork, poultry, eggs, milk, cereal and bakery items, processed vegetables, and beverages).
| Category | Lowest 20% | 21%-40% Lowest Income | Middle Income | 21%-40% Highest Income | Highest 20% |
| Before-tax income | $11,862 | $31,422 | $54,944 | $90,483 | $205,403 |
| Annual spending on... | |||||
| Total food | $4,201 | $5,688 | $6,968 | $9,106 | $13,574 |
| Food at home | $2,720 | $3,596 | $4,089 | $5,085 | $6,889 |
| Food away from home | $1,481 | $2,092 | $2,879 | $4,021 | $6,684 |
| Percentage of income spent on... | |||||
| All food | 35.4% | 18.1% | 12.7% | 10.1% | 6.6% |
| Food at home | 22.9% | 11.4% | 7.4% | 5.6% | 3.4% |
| Food away from home | 12.5% | 6.7% | 5.2% | 4.4% | 3.3% |
| Percentage of food at home spending on... | |||||
| Meat | 18.2% | 18.2% | 17.3% | 17.3% | 16.8% |
| Beef | 6.0% | 6.0% | 5.9% | 6.0% | 5.6% |
| Pork | 4.6% | 4.7% | 4.2% | 4.0% | 3.6% |
| Poultry | 4.4% | 4.4% | 4.1% | 4.2% | 4.0% |
| Fish and seafood | 3.1% | 3.1% | 3.1% | 3.1% | 3.1% |
| Eggs | 1.6% | 1.5% | 1.4% | 1.3% | 1.3% |
| Dairy | 10.0% | 9.9% | 10.1% | 10.1% | 10.3% |
| Fresh milk and cream | 3.7% | 3.5% | 3.4% | 3.3% | 3.1% |
| Cereal and bakery | 13.1% | 13.0% | 13.0% | 12.8% | 12.5% |
| Fats and oils | 2.8% | 2.8% | 2.7% | 2.6% | 4.1% |
| Sugar and other sweets | 3.4% | 3.5% | 3.5% | 3.5% | 3.8% |
| Fruits and vegetables | 18.6% | 18.9% | 18.9% | 19.1% | 19.7% |
| Fresh fruit | 6.6% | 6.8% | 6.9% | 7.1% | 7.5% |
| Processed fruit | 2.7% | 2.6% | 2.6% | 2.6% | 2.6% |
| Fresh vegetables | 6.0% | 6.1% | 6.2% | 6.2% | 6.6% |
| Processed vegetables | 3.4% | 3.4% | 3.3% | 3.2% | 3.0% |
| Beveragesa | 15.1% | 12.8% | 11.8% | 11.3% | 10.1% |
| Non-alcohlic beverages | 10.6% | 10.2% | 9.9% | 9.7% | 8.9% |
aThe Bureau of Labor Statistics also reports sales of alcoholic beverages as a separate category from both food at home and food away from home.
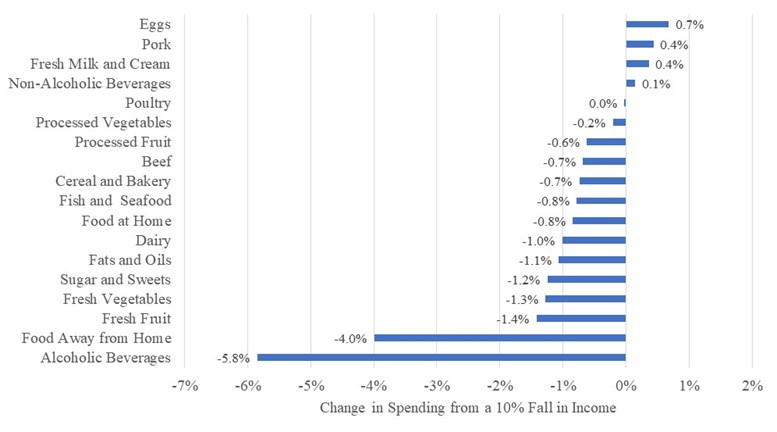
The key question relevant to this paper is how spending and consumption of specific food items vary with income. Figure 1 reports the estimated changes in spending and consumption anticipated to occur with a 10% drop in income, which might occur in a recession.1 A 10% decrease in income is associated with a slight increase in spending and consumption of eggs, pork, milk, and nonalcoholic beverages. However, expected spending on the majority of food categories is adversely affected by a negative income shock, and the categories most negatively affected include fresh vegetables, fresh fruit, FAFH, and alcoholic beverages.
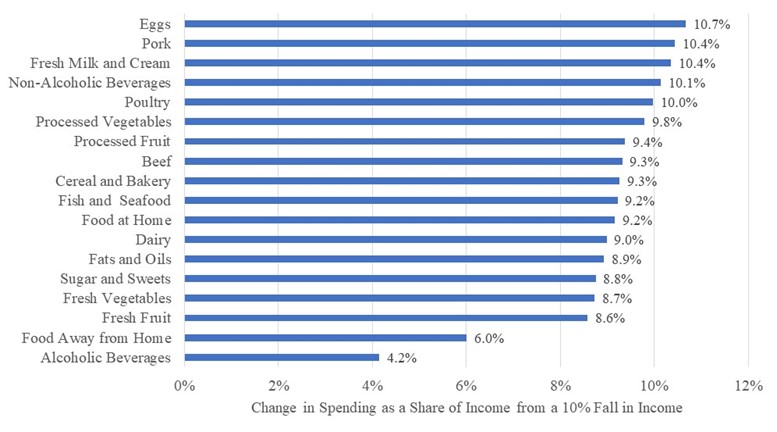
Because of the general Engel-curve relationship that exists with all food categories (i.e., the share of spending on food falls with income), it is logical to expect that a fall in income will be associated with an increase in the share of income spent on food. These relationships are illustrated in Figure 2. We estimate that a 10% reduction in income with be associated with a roughly 10% increase in the share of income spent on eggs, pork, milk, and nonalcoholic beverages. We previously demonstrated (Figure 1) that falling income disproportionately affected spending on FAFH, alcoholic beverages, and fresh fruits and vegetables; accordingly, Figure 2 shows that the share of income allocated to these items does not rise as fast as other foods as income falls. Still, the fact that the estimated values in Figure 2 are all positive illustrates that a recession-induced income drop would be expected to increase the importance of food in consumers’ total budgets. This further illustrates that food is a necessity, meaning consumption of the good changes less than proportionately with income, at least for middle-income consumers. For the highest-income consumers, we actually find that most food categories (besides FAFH and alcoholic beverages) are inferior goods, which means that a fall in income for this group would actually increase their spending on most FAH categories, likely resulting from a budget reallocation of FAFH to more FAH.
An important caveat to the preceding discussion is that the food categories are broad and represent many different types of products. For example, consider the beef category, which includes pricey steaks and affordable hamburger. Lusk and Tonsor (2016) show that as incomes rise, demand for beef steaks increases; by contrast, rising income is associated with lower demand for ground beef. In addition to switching between goods with a category, it is also possible to substitute higher- for lower-quality (or branded vs. generic branded) foods (Griffith et al., 2009) or by choosing less convenient versions of the same food, such as unprocessed versus bagged salads as incomes fall (Kuchler, 2011).
While the current recession has different causes and features than the Great Recession, they share the common feature of rising unemployment. As a result, it is instructive to explore how consumers changed food consumption habits during the last economic downturn.
Food service, and particularly restaurants, also suffered during the Great Recession (Saksena et al., 2018). From 2007 to 2010, total household food spending fell 7% and did not fully recover until 2015. Most of this reduction in food spending occurred as a result of consumers spending less eating out. The average household spent 40.5% of their FAFH budget in 2005, a figure that fell to 36.3% in 2010 (Saksena et al., 2018). These findings have been confirmed by numerous data sources. For example, grocery scanner data reveal that during the Great Recession, spending at groceries and supermarkets increased across the board as consumers reallocated spending that from FAFH toward FAH (Cha, Chintagunta, and Dhar, 2015).
In the Great Recession, fast food performed better relative to more expensive substitutes like full-service restaurants (Youn and Gu, 2009). The implication is that options with a smaller income elasticity are positioned to fare better during recessions. However, there is some evidence that there was not a difference between income elasticities across restaurant formats during the Great Recession and that fast-food restaurants performed better due to implementing more effective cost controls (Koh, Lee, and Choi, 2013).
Using county-level unemployment data, Cha, Chintagunta, and Dhar (2015) found that, in response to higher unemployment in a county, most household types increased the quantity of food purchased at grocery stores, presumably because consumers substituted away from FAFH. This effect was largest for older, more educated, and middle-income consumers. Overall, lower-income households had the largest decline in spending on FAFH from 2007 to 2009, while middle-income households experienced the slowest recovery in FAFH spending after the Great Recession (Saksena et al., 2018). However, after controlling for income, decrease in FAFH consumption was only observed in working-age adults, implying that falling opportunity cost, likely associated with increased unemployment, was more responsible for the decrease than income (Todd and Morrison, 2014).
A factor observed during the Great Recession that is even more relevant in the current environment is the significant reduction in average hours worked across consumers. Data indicate that during the Great Recession, of the increase in time available from forgone work, about 50% went to leisure activities (e.g., watching TV and sleeping) and 30% went to home production (e.g., cooking and cleaning) (Aguiar, Hurst, and Karabarbounis, 2013). In addition to having more time for cooking and cleaning, people also have more time to invest in shopping. For example, Griffith, O’Connell, and Smith (2016) found that U.K. consumers reduced their food expenditures during the Great Recession but did so without reducing the number of calories or nutrients consumed. They found that this was primarily accomplished by consumers expending greater time and effort in shopping by taking greater advantage of sales, switching to generic products, etc. These findings are consistent with those in Nevo and Wong (2019), who found that during the Great Recession, U.S. consumers adopted a variety of tactics to economize on food shopping, including greater use of coupons, more purchases on sale, and more bulk and generic purchases, behaviors which the authors attributed to substitution of time spent at paid work for time spent in home production and shopping.
While firm data do not yet exist during the COVID-19 era, it is possible to imagine an even greater increase in time available for home production over the recent months than during the Great Recession; like the Great Recession, there is an increase in unemployment and underemployment, but there has also been a reduction in commuting times and time spent away from home. These trends would suggest that, like in the Great Recession, the opportunity costs of time have fallen, which may lead to home production (i.e., cooking) and greater time spent searching for lower-cost options. At the same time, consumers may spend less time inside grocery stores if they are concerned about exposure to the coronavirus.
Individuals and households who lost employment during the Great Recession were more likely to be food insecure (Birkenmaier, Huang, and Kim, 2016; Huang, Kim, and Birkenmaier, 2016). Food insecurity increased similarly for households with and without children during the Great Recession; however, the increases for households with children was proportionally larger and reached 21% in 2008 (Andrews and Nord, 2009). Female-headed households with children had higher food insecurity compared to married households across all residence areas (Coleman-Jensen, 2012). Moreover, compared to males within the same household, females have higher levels of perceived food insecurity because of relatively higher levels of involvement in food procurement and preparation (Carney, 2012).
Many families live in the suburbs, and there is evidence that residents of suburbs experienced similar levels of food insecurity as urban residents and that both had higher food insecurity than rural residents during the economic downturn (Coleman-Jensen, 2012). Additionally, food pantry usage grew at similar rates in urban and nonurban areas, increasing 44% between 2007 and 2009, and government spending on nutrition assistance programs increased 27% in 2009 (Andrews, 2010). SNAP caseloads increased 56% during the Great Recession (Saksena et al., 2018), and increased use occurred in areas with pronounced home foreclosures and unemployment and not areas with high SNAP participation prior to the Great Recession (Slack and Myers, 2014). When the economy began to recover in 2009 and unemployment fell, low-income households continued to struggle with food insecurity due to rising inflation and higher food prices so that food insecurity remained relatively high through 2013 (Coleman-Jensen and Gregory, 2014; Cha, Chintagunta, and Dhar, 2015).
While the Great Recession and the pandemic are similar in that they both led to income loss and unemployment, the latter introduced additional barriers that might affect food security including the closure of school cafeterias and restaurants. Preliminary research about the effects of COVID-19 on food security in the United States is mixed. Some research finds virtually no change in food insecurity (Ahn and Norwood, 2020) in the wake of COVID-19, while other research indicates food insecurity has increased by 12 percentage points (Bitler, Hoynes, and Schanzenbach, 2020); however, all results point to households with children being disproportionately impacted and suffering from higher rates of food insecurity. While it will take more time and data to fully understand the impact of COVID-19 on food insecurity, it is clear that households were seeking additional resources. Data indicate that food banks distributed 20% more food than normal between the beginning of March and end of June (Feeding America, 2020).
As previously described, the Great Recession affected time availability, and thus shopping and food spending. The findings linking time availability and opportunity cost of time on consumer shopping behavior, however, are broader than those related to the Great Recession and include impacts of income and retirement. We now turn to this additional literature for additional insights on how COVID-19 might affect food spending.
In general, one expects retirements to be associated with an increase in free time and a decrease in disposable income (Attanasio and Weber, 2010). While these changes are largely anticipated, previous research has found a much larger reduction in consumption than would be expected given the reduction in earnings, particularly as it relates to food (Bernheim, Skinner, and Weinberg, 2001; Battistin et al., 2009; Aguila, Attanasio and Meghir, 2011; Stancanelli and Van Soest, 2012). These effects appear primarily for food but not other items such as spending on durables (Aguila, Attanasio and Meghir, 2011). The so-called “consumption puzzle” seems to be primarily explained by the substantial increase in time available during retirement. Given the lower opportunity cost of time, retirees spend more time in cooking, shopping, and other activities, which lowers the monetary costs of food. For example, Stancanelli and Van Soest (2012) find that among a sample of French consumers facing a mandatory retirement age, retirement increases the amount of “housework” by about three hours per weekday relative to otherwise identical individuals just below the retirement age cutoff. Using variation in pension eligibility as an identification strategy among Italian consumers, Battistin et al. (2009) find that, upon retirement, spending on meals away from home falls more than 40%, while food at home spending remains relatively constant. Taken together, these results suggest more time at home during COVID-19 is likely induce more home production of food; these effects are likely above and beyond whatever impacts were caused by the shutdowns of food service establishments.
Income also affects the opportunity cost of time, and it is generally thought that lower income households face lower opportunity costs of time than higher-income households. Previous research has found that low-income consumers pay less for the same foods than wealthier consumers (Broda, Leibtag, and Weinstein, 2009). Comparing purchases of products with the exact same Universal Product Code (UPCs), Broda, Leibtag, and Weinstein (2009) find a 10% increase in income is associated with a 0.1% increase in price paid per item. This occurs both because lower-income households shop in different locations than their wealthier counterparts and also expend greater time searching for better deals. Other research shows that lower-income households are more likely to find food savings through bulk buying and choosing economy brands than higher-income households (Griffith et al., 2009). While COVID-19 has led to rapid overall food price inflation at grocery stores (Mead et al., 2020), there were likely opportunities for consumers with lower opportunity costs of time to economize. Moreover, to the extent that there was an aggregate shift in time availability during COVID-19, this might have helped keep food price inflation lower than it might otherwise had been without such a shift.
Negative income shocks, like those typically experienced during recessions, result in decreased spending on FAH and FAFH, but particularly on FAFH. Results presented here indicate that some FAH categories (e.g., eggs) might benefit slightly from falling income but that spending decreases for most food categories. While overall food spending typically decreases during a recession, food becomes a more prominent portion of consumers’ total budgets. There is heterogeneity across income groups, perhaps because of differences in budget allocation between FAH and FAFH prior to a negative income shock. For example, consumers with the highest income may actually increase spending on FAH during a recession as they stop eating out as much and consume more at home. Further, there will likely be nuanced changes within a food category during a recession, as categories are aggregated by types of food, and different foods within a category (e.g., beef steak and ground beef) may have very different income elasticities.
During the Great Recession, fast food was better positioned to weather the storm than full-service restaurants. As was the case during the Great Recession, fast-food restaurants might be able to implement more effective cost controls during the downturn caused by COVID-19 and capitalize and selling relatively affordable food away from home. Of course, the situation with COVID-19 is different because of the explicit restrictions on restaurant dining in many locales and the voluntary actions on the part of consumers to avoid restaurants to minimize exposure from others. Even if there hadn’t been any explicit prohibitions against eating out or voluntary actions to avoid exposure, the evidence presented here suggest that that restaurant spending would have taken a hit for those who experienced falling incomes. We can also expect a need for additional food resources for households with children and particularly for female-headed households. Also, variation in macroeconomic characteristics (e.g., unemployment) across geographic regions is likely an indicator of increased need for food assistance.
Unemployment and the falling income that typically follows also reduce opportunity costs of time. The, likely unwanted, new-found free time during a recession allows consumers to search for deals and lower-priced substitutes. This may allow households to decrease the overall food budget without reducing the number of calories or nutrients consumed. COVID-19 is an unusual recession in the sense that aggregate personal disposable income has remained high because of massive government crisis relief payments and increases in unemployment benefits. Nonetheless, it remains the case that many households have faced adverse economic shocks during COVID-19 and others have faced shifts in their time allocation.
While this paper discussed how food spending may change due to recessions, we do not touch on behavioral responses to negative income shocks or the health implications of the changes in food spending. Prior research has found that meals eaten away from home tend to be higher in calories and lower in diet quality than those eaten at home (Todd, Mancino, and Lin, 2010). Thus, it is possible that the reduction in eating out during COVID-19 may have some health benefits, although it has also been argued that COVID-19 could lead to increases in sedentary behavior, increased caloric consumption, and weight gain (Bhutani and Cooper, 2020). These are lines of research that will likely gain more attention during and after the COVID-19 recession compared to the Great Recession. For example, negative shocks to income may exacerbate behavioral biases such as hyperbolic discounting and increase the likelihood that an individual will exhibit present bias and unduly discount future health outcomes (Haushofer and Fehr, 2013). In an experimental setting, negative income shocks have been linked to preferences for immediate reinforcements, including fast food (Mellis et al., 2018). Food insecurity, in general, has been observed to decrease fruit and vegetable consumption (Kendall, Olson, and Frongillo, 1996). Thus, it is not just the spending that may change during a recession but also our relationship with food and both have societal implications.
Aguiar, M., E. Hurst, and L. Karabarbounis. 2013. “Time Use during the Great Recession.” American Economic Review 103(5): 1664–1696.
Aguila, E., O. Attanasio, and C. Meghir. 2011. “Changes in Consumption at Retirement: Evidence from Panel Data.” Review of Economics and Statistics 93(3): 1094–1099.
Ahn, S., and F.B. Norwood. 2020. “Measuring Food Insecurity during the COVIDâ€19 Pandemic of Spring 2020.” Applied Economic Perspectives and Policy 43(1): 162–168.
Andrews, M., 2010. “More Americans Relied on Food Assistance during Recession.” Amber Waves 8(4): 4.
Andrews, M.S., and M. Nord. 2009. “Food Insecurity Up in Recessionary Times.” Amber Waves.
Attanasio, O.P., and G. Weber. 2010. "Consumption and Saving: Models of Intertemporal Allocation and Their Implications for Public Policy." Journal of Economic Literature 48(3): 693–751.
Battistin, E., A. Brugiavini, E. Rettore, and G. Weber. 2009. “The Retirement Consumption Puzzle: Evidence from a Regression Discontinuity Approach.” American Economic Review 99(5): 2209–2226.
Beatty, T.K., and J.T. LaFrance. 2005. “United States Demand for Food and Nutrition in the Twentieth Century.” American Journal of Agricultural Economics 87(5): 1159–1166.
Bernheim, B.D., J. Skinner, and S. Weinberg. 2001. “What Accounts for the Variation in Retirement Wealth among US Households?” American Economic Review 91(4): 832–857.
Bhutani, S., and J.A. Cooper. 2020. “COVIDâ€19 Related Home Confinement in Adults: Weight Gain Risks and Opportunities.” Obesity 28: 1576–1577.
Birkenmaier, J., J. Huang, and Y. Kim. 2016. “Food Insecurity and Financial Access during an Economic Recession: Evidence from the 2008 SIPP.” Journal of Poverty 20(2): 194–213.
Bitler, M., H.W. Hoynes, and D.W. Schanzenbach. 2020. The Social Safety Net in the Wake of COVID-19. National Bureau of Economic Research Working Paper w27796.
Broda, C., E. Leibtag, and D.E. Weinstein. 2009. “The Role of Prices in Measuring the Poor’s Living Standards.” Journal of Economic Perspectives 23(2): 77–97.
Carney, M., 2012. “Compounding Crises of Economic Recession and Food Insecurity: A Comparative Study of Three Low-Income Communities in Santa Barbara County.” Agriculture and Human Values 29(2): 185–201.
Cha, W.M., P.K. Chintagunta, and S.K. Dhar. 2015. Food Purchases during the Great Recession. Kilts Center for Marketing at Chicago Booth–Nielsen Dataset Paper Series.
Chetty, R., Friedman, J.N., Hendren, N., Stepner, M. and The Opportunity Insights Team, 2020. The economic impacts of COVID-19: Evidence from a new public database built using private sector data (No. w27431). National Bureau of Economic Research.
Coleman-Jensen, A. 2012. “Predictors of US Food Insecurity across Nonmetropolitan, Suburban, and Principal City Residence during the Great Recession.” Journal of Poverty 16(4): 392–411.
Coleman-Jensen, A., and C. Gregory. 2014. “Inflation and Higher Food Prices Kept Food Insecurity Rates Relatively High after the 2007-09 Recession.” Amber Waves.
Federal Reserve Economic Data (FRED). 2021a. “Personal Income.” Available online: https://fred.stlouisfed.org/series/PI
Federal Reserve Economic Data (FRED). 2021b. “Personal Savings Rates.” Available online: https://fred.stlouisfed.org/series/PSAVERT
Feeding America. 2020. The First Months of the Food Bank Response to COVID, by the Numbers. Available at: https://www.feedingamerica.org/hunger-blog/first-months-food-bank-response-covid-numbers [Accessed September 17, 2020].
Ferrier, P., C. Zhen, and J. Bovay. 2018. “Price and Welfare Effects of the Food Safety Modernization Act Produce Safety Rule.” Paper presented at the meeting of the International Association of Agricultural Economists, July 28–August 2, Vancouver, British Columbia.
Griffith, R., E. Leibtag, A. Leicester, and A. Nevo. 2009. “Consumer Shopping Behavior: How Much Do Consumers Save?” Journal of Economic Perspectives 23(2): 99–120.
Griffith, R., M. O’Connell, and K. Smith. 2016. “Shopping around: How Households Adjusted Food Spending over the Great Recession.” Economica, 83(330): 247–280.
Haushofer, J., D. Schunk, and E. Fehr. 2013. “Negative income shocks increase discount rates.” Available online: https://haushofer.ne.su.se/publications/Haushofer_Fehr_IncomeShocks_2019.pdf
Huang, J., Y. Kim, and K. Birkenmaier. 2016. “Unemployment and Household Food Hardship in the Economic Recession.” Public Health Nutrition 19(3): 511–519.
Kendall, A., C.M. Olson, and E.A. Frongillo Jr. 1996. “Relationship of Hunger and Food Insecurity to Food Availability and Consumption.” Journal of the American Dietetic Association 96(10): 1019–1024.
Koh, Y., S. Lee, and C. Choi. 2013. “The Income Elasticity of Demand and Firm Performance of US Restaurant Companies by Restaurant Type during Recessions.” Tourism Economics 19(4): 855–881.
Kuchler, F. 2011. “Is It Food Quality or Quantity That Responds to Changing Income?” Applied Economic Perspectives and Policy 33(2): 205–221.
Leser, C.E.V. 1963. “Forms of Engel Functions.” Econometrica 31(4): 694–703.
Lusk, J.L., and G.T. Tonsor. 2016. “How Meat Demand Elasticities Vary with Price, Income, and Product Category.” Applied Economic Perspectives and Policy 38(4): 673–711.
Mead, D., K. Ransom, S.B. Reed, and S. Sager. 2020. “The Impact of the COVID-19 Pandemic on Food Price Indexes and Data Collection.” Monthly Labor Review. Available online: https://www.bls.gov/opub/mlr/2020/article/the-impact-of-the-covid-19-pandemic-on-food-price-indexes-and-data-collection.htm.
Mellis, A.M., L.N. Athamneh, J.S. Stein, Y.Y. Sze, L.H. Epstein, and W.K. Bickel. 2018. “Less Is More: Negative Income Shock Increases Immediate Preference in Cross Commodity Discounting and Food Demand.” Appetite 129: 155–161.
National Bureau of Economic Research (NBER). 2021. “Business Cycle Dating” Available online: https://www.nber.org/research/business-cycle-dating
Nelson, E., J.M. Fitzgerald, N. Tefft, and J. Anderson. 2017. “US Household Demand for Organic Fruit.” SSRN 3081997.
Nevo, A., and A. Wong. 2019. “The Elasticity of Substitution between Time and Market Goods: Evidence from the Great Recession.” International Economic Review 60(1): 25–51.
Saksena, M.J., A.M. Okrent, T.D. Anekwe, C. Cho, C. Dicken, A. Effland, H. Elitzak, J. Guthrie, K.S. Hamrick, J. Hyman, Y. Jo, B.-H. Lin, L. Mancino, P.W. McLaughlin, I. Rahkovsky, K. Ralston, T.A. Smith, H. Stewart, J. Todd, and C. Tuttle. 2018. America’s Eating Habits: Food Away from Home. Washington, DC: U.S. Department of Agriculture, Economic Research Service, Economic Information Bulletin EIB-196.
Slack, T., and C.A. Myers. 2014. “The Great Recession and the Changing Geography of Food Stamp Receipt.” Population Research and Policy Review 33(1): 63–79.
Stancanelli, E., and A. Van Soest. 2012. “Retirement and Home Production: A Regression Discontinuity Approach.” American Economic Review 102(3): 600–605.
Todd, J.E., L. Mancino, and B.H. Lin. 2010. The Impact of Food Away from Home on Adult Diet Quality. Washington, DC: U.S. Department of Agriculture, Economic Research Service, Economic Research Report ERR-90.
Todd, J., and R.M. Morrison. 2014. “Less Eating Out, Improved Diets, and More Family Meals in the Wake of the Great Recession.” Amber Waves 2.
U.S. Bureau of Labor Statistics. 2020. “Consumer Expenditure Survey—Customized Tables.” Washington, DC: U.S. Bureau of Labor Statistics. Available online: https://data.bls.gov/cgi-bin/dsrv?cx.
Working, H. 1943. “Statistical Laws of Family Expenditure.” Journal of the American Statistical Association 38(221): 43–56.
Youn, H., and Z. Gu. 2009. “US restaurant firm performance check: An examination of the impact of the recent recession.” Journal of Hospitality Financial Management 17(2): 35–53.
1 These estimates are based on five years of data for each income quantile for each food (i.e., 25 observations for each food category). Working–Leser models are estimated where the log of income and yearly fixed effects are regressed against the share of income spent on each food (Working, 1943; Leser, 1963). These estimates are used to calculate income elasticities and share elasticities, both evaluated at the middle-income spending shares.

