The year 2020 started with renewed optimism in the U.S. agricultural sector. In 2019, farm income was modestly higher than the prior year, but well below levels seen from 2011 to 2014. In addition, Market Facilitation Program payments to compensate producers for lost trade opportunities represented nearly 17% of net farm income. Prospects for the sector appeared to improve after the January 15 signing of the Phase One trade agreement with China, which sought to cool the trade tensions that had dominated agricultural markets for much of the prior year and a half. Within this same week, however, the World Health Organization (WHO, 2020) reported the first confirmed case of COVID-19 outside of the borders of China.
The impacts of COVID-19 on the agricultural sector have varied considerably by commodity and by marketing channel. Notable impacts included supply-chain disruptions, shifts in consumer demands reflecting changes in purchasing and consumption habits in the face of widespread shutdown orders, and concerns about a more general economic slowdown.
In this article, we explore the shift in the outlook, based two sets of projections from a large-scale partial equilibrium model used for policy analysis, for farm income and for principal crop markets. The first outlook was prepared immediately after the signing of the Phase One agreement and published in March 2020 (FAPRI, 2020a) and the second was prepared in August 2020, several months into the crisis (FAPRI, 2020b,c). The partial equilibrium model covers program crops (crops covered by the commodity title of the U.S. Farm Bill, including grains, oilseeds and cotton) and livestock in significant detail while addressing specialty crops’ contribution to farm income in a more simplistic fashion. For most commodities COVID-19—and the government response to it—was the main driving force for the change in sectoral prospects between January and August. In the final months of 2020, a number of factors unrelated to COVID-19 helped brighten the outlook for crop prices and farm income, as discussed in the final section of the paper.
In an environment of solid global and U.S. macroeconomic growth, the year 2020 started with a general expectation of a rebound in crop planted area and, with it, supplies of many program crops after widespread precipitation in the spring of 2019 led to record large acres of prevented plantings across the Midwest. The announced Phase One agreement provided a target for the value of bilateral trade between the United States and China and commitments to reduce nontariff barriers, but with several statements in the document that purchases would be made “at the market.” Achieving the trade-value targets of the Phase One agreement appeared daunting and ultimately the 2020 targets were not achieved. However, a sharp rebound in trade with China, even if short of the target, seemed both achievable and supportive of crop and livestock prices and set the tone for the outlook for program crop prices for the remainder of 2019/20 marketing year and into the next season.
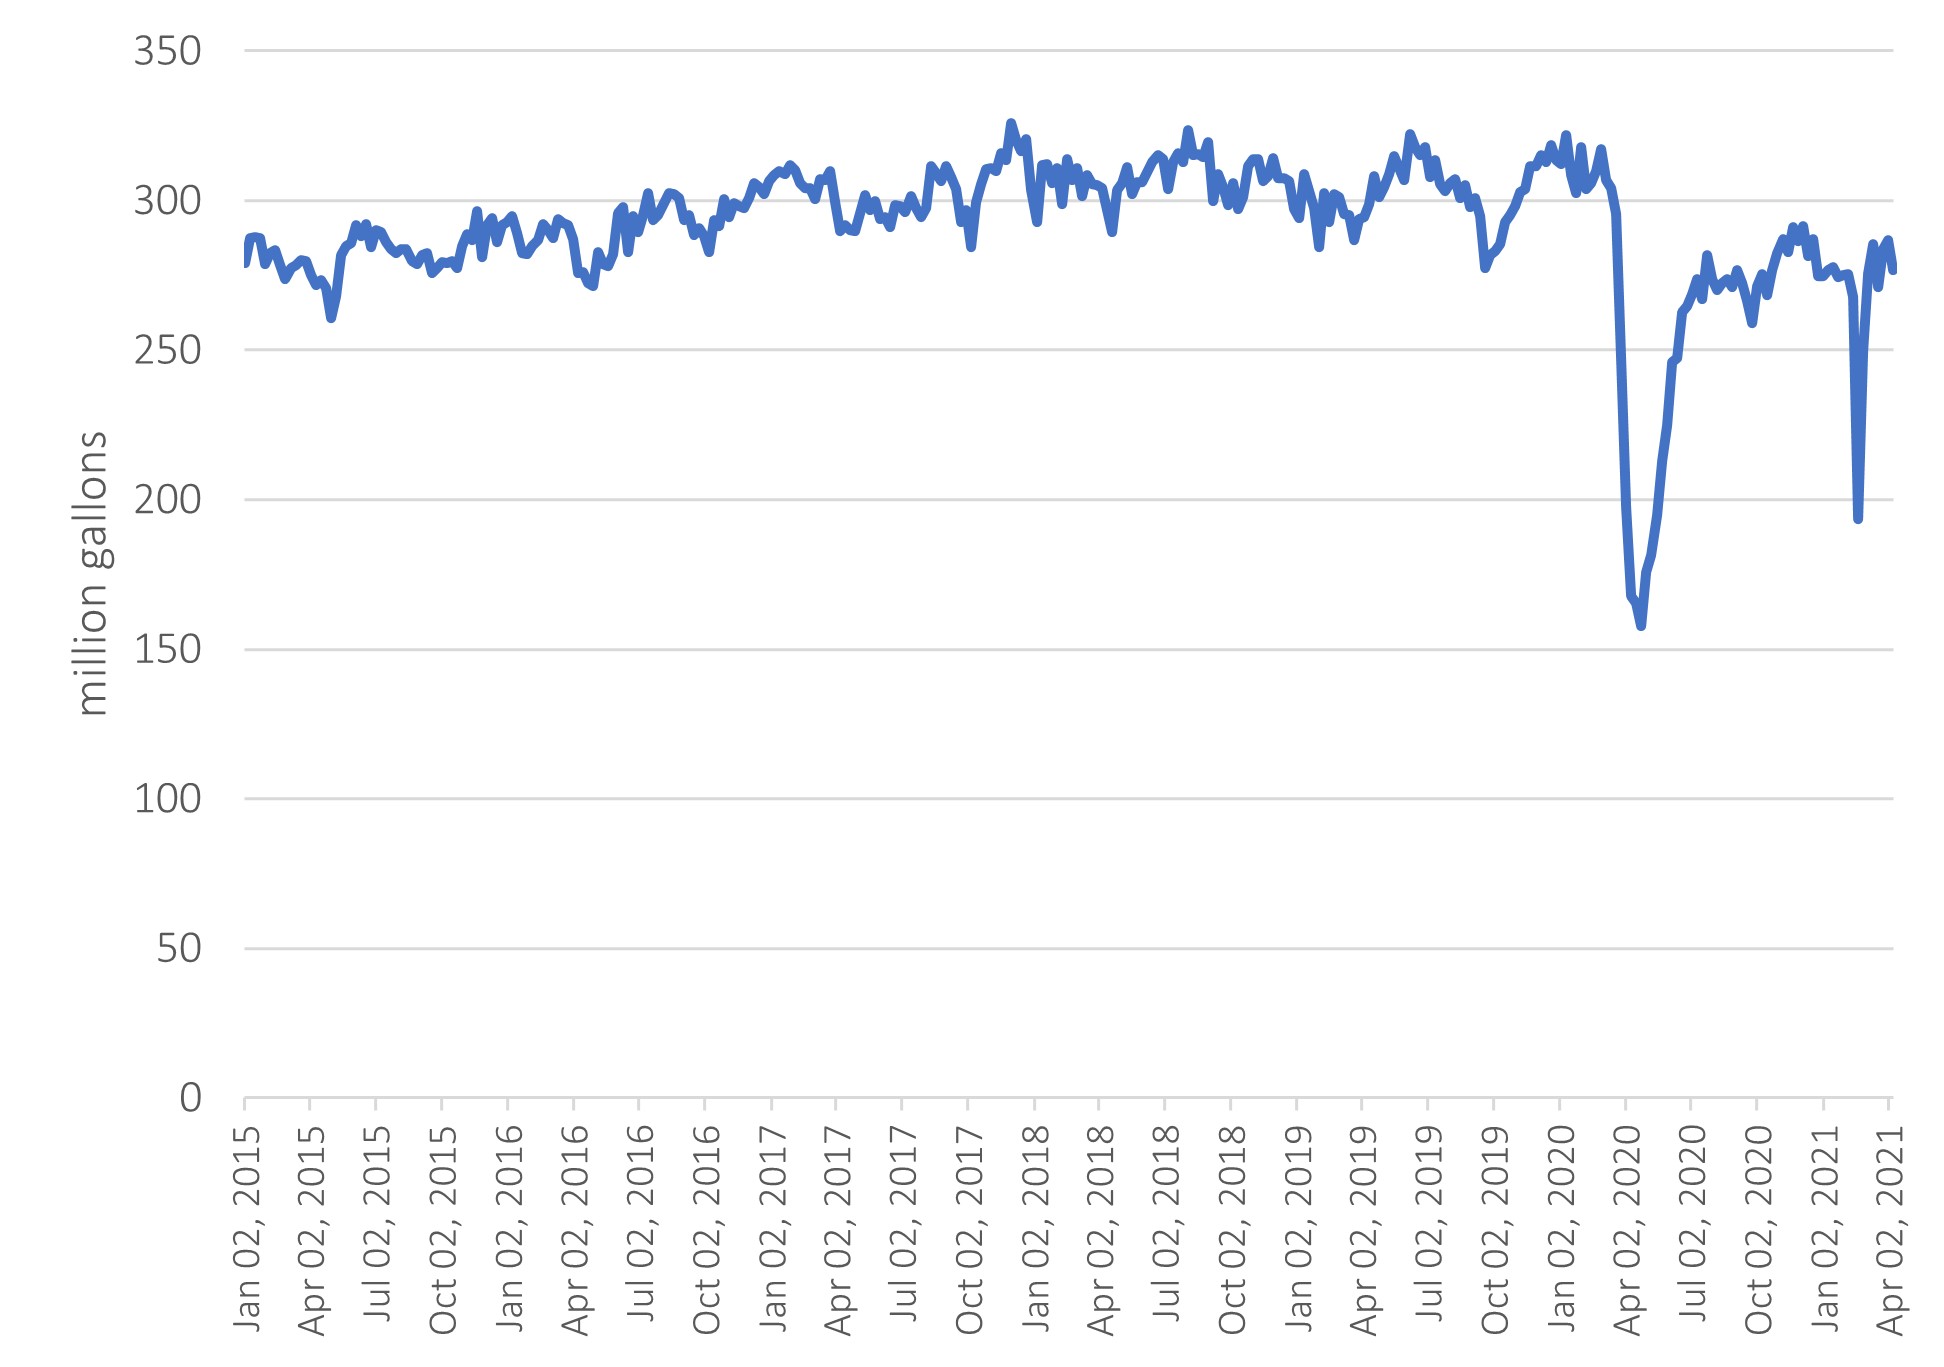
Source: Energy Information Agency.
With the emergence and spread of COVID-19 among the U.S. population and around the globe, the major program crops appeared to suffer fewer supply chain disruptions than did livestock and specialty crop products. They were, however, not entirely insulated from other COVID-19 impacts. While impacts on the production and distribution of the program crops were limited, more notable impacts were observed on demand.
As a result of widespread shutdown orders, miles driven, and—with it—motor fuel consumption, fell sharply in April 2020. Fuel use rebounded in the late spring and summer of 2020, but it remained below pre-pandemic levels (Figure 1). While the Energy Independence and Security Act of 2007 established renewable fuel volumes on an annual basis and is a primary driver for ethanol consumption levels, rule implementation by the Environmental Protection Agency (EPA) converts the volume target into a percentage inclusion rate in motor fuel each calendar year. As such, the domestic demand for ethanol, largely made from corn, fluctuates in near lockstep with intra-year motor fuel demand. Lower ethanol demand resulted in lower ethanol prices, reduced ethanol production, a cut in corn use, an increase in expected corn carryover stocks, and lower corn prices (Table 1).
| Pre-COVID-19 Phase One Outlook March 2020 |
Phase One and COVID-19 Outlook August 2020 |
Change | |||||||||
| Marketing Year | 16/17 | 17/18 | 18/19 | 19/20 | 20/21 | 19/20 | 20/21 | 19/20 | 20/21 | ||
| Corn ($/bu) | 3.36 | 3.36 | 3.61 | 3.90 | 3.70 | 3.60 | 3.24 | -0.30 | -0.46 | ||
| Wheat ($/bu) | 3.89 | 4.72 | 5.16 | 4.54 | 4.84 | 4.58 | 4.55 | 0.04 | -0.29 | ||
| Sorghum ($/bu) | 2.79 | 3.22 | 3.26 | 3.71 | 3.73 | 3.25 | 3.22 | -0.46 | -0.51 | ||
| Barley ($/bu) | 4.96 | 4.47 | 4.62 | 4.70 | 4.61 | 4.70 | 4.46 | 0.00 | -0.16 | ||
| Oats ($/bu) | 2.06 | 2.59 | 2.66 | 2.97 | 2.88 | 2.88 | 2.66 | -0.09 | -0.23 | ||
| Soybeans ($/bu) | 9.47 | 9.33 | 8.48 | 8.97 | 8.85 | 8.55 | 8.24 | -0.42 | -0.61 | ||
| Soybean meal ($/ton) | 316.88 | 345.02 | 308.28 | 304.70 | 303.06 | 300.00 | 286.41 | -4.70 | -16.65 | ||
| Soybean oil (cents/lb) | 32.55 | 30.04 | 28.26 | 33.55 | 32.47 | 29.00 | 29.79 | -4.55 | -2.68 | ||
| Peanuts (cents/lb) | 19.70 | 22.90 | 21.50 | 20.93 | 22.18 | 20.40 | 20.48 | -0.53 | -1.70 | ||
| Sunflowers (cents/lb) | 17.40 | 17.20 | 17.40 | 18.08 | 17.45 | 19.20 | 17.77 | 1.12 | 0.33 | ||
| Canola (cents/lb) | 16.60 | 17.50 | 15.80 | 14.50 | 14.97 | 14.80 | 15.46 | 0.30 | 0.49 | ||
| Upland cotton (cents/lb) | 68.00 | 68.60 | 70.30 | 62.13 | 61.70 | 59.50 | 57.43 | -2.63 | -4.27 | ||
| Rice ($/cwt) | 10.40 | 12.90 | 12.30 | 13.20 | 13.09 | 13.10 | 12.70 | -0.10 | -0.39 | ||
| Long grain ($/cwt) | 9.61 | 11.50 | 10.80 | 12.20 | 12.01 | 12.00 | 11.66 | -0.20 | -0.35 | ||
| Japonica ($/cwt) | 14.10 | 20.10 | 20.00 | 18.30 | 18.28 | 18.50 | 18.13 | 0.20 | -0.15 | ||
| Other M&S grain ($/cwt) | 10.10 | 11.70 | 12.30 | 12.20 | 12.45 | 11.70 | 11.67 | -0.50 | -0.78 | ||
| All hay ($/ton) | 129.00 | 142.00 | 166.00 | 165.22 | 165.38 | 165.00 | 163.23 | -0.22 | -2.14 | ||
| Distillers grains ($/ton) | 105.29 | 149.69 | 145.90 | 150.57 | 143.44 | 157.81 | 135.85 | 7.24 | -7.59 | ||
Source: FAPRI (2020a,b,c).
Similarly, the widespread shutdown of retail outlets and work sites, both here and abroad, reduced demand for clothing and cotton products, cutting the global demand for cotton and pushing down the price for the fiber. Soybean prices were also negatively affected, not so much because the pandemic reduced demand but because of concerns that lower corn prices would cause farmers here and in other countries to shift acreage out of corn and into soybeans. In contrast, wheat and rice prices received temporary support as countries rushed to secure supplies in the face of major uncertainty regarding the impact of the pandemic on supply chains and food security.

Source: FAPRI (2020a,b,c).
The COVID-19 shocks across the agricultural sector, discussed in depth in this issue of Choices, sharply reduced 2020 projected farm cash receipts by 9% between early March and August 2020 (Figure 2, Table 2). Much of the change in expectations for crop and livestock receipts, a decline of 9% in the estimate for their combined receipts for 2020, can be attributed to declines in demand for raw farm commodities and reflected in lower farm-level prices. The shift in demand was a result of supply chain disruptions, reduced travel and mobility, and, more broadly, uncertainty and weakness in the general economy here and abroad.
Prospects for 2020 feed grains cash receipts were reduced by 10%, primarily because of the reduction in ethanol use and corn prices. The reduction in projected oilseed receipts was a more modest 5%, as the projected reduction in soybean prices was smaller than in the case of corn. Projections of 2020 food grains receipts, such as wheat and rice, actually increased slightly, as those crops benefited from the temporary jump in global demand for food staples and some specific shifts in demand, such as a run on baking flour in the United States (Dunn, 2020).
Livestock packing plant shutdowns and slowdowns had negative effects on both farmers and consumers, reducing prices offered for live animals and increasing wholesale and retail meat prices. Hog, cattle and chicken prices all fell, resulting in large reductions in projected cash receipts. Shifts in demand, with the widespread closure of schools and their large fluid milk consumption, as well as processing capacity limitations, similarly affected fluid milk demand in some locations, leading to localized milk dumping while simultaneously producing scarcity at retail outlets. As a result of these declines, 2020 crop and livestock cash receipts were expected to be $35 billion lower in August than first estimated before the pandemic struck, with the animal sector accounting for most of the reduction.
| Pre-COVID-19 Phase One Outlook, March 2020 | Phase One and COVID-19 Outlook, August 2020 | Absolute Change |
Percentage Change |
|
| Receipts | ||||
| Feed grains (corn, sorghum, etc.) | 61.64 | 55.42 | -6.22 | -10.1% |
| Food grains (wheat, rice, etc.) | 11.44 | 11.75 | 0.31 | 2.7% |
| Oilseeds (soybeans, peanuts, etc.) | 38.86 | 36.91 | -1.95 | -5.0% |
| Cotton (fiber and seed) | 7.21 | 5.89 | -1.32 | -18.3% |
| Other crops (fruits, vegetables, etc.) | 83.96 | 83.81 | -0.15 | -0.2% |
| Cattle | 71.34 | 61.81 | -9.54 | -13.4% |
| Hogs | 26.15 | 18.50 | -7.66 | -29.3% |
| Dairy products | 43.07 | 39.07 | -4.00 | -9.3% |
| Poultry, eggs (broilers, turkeys, etc.) | 41.22 | 37.23 | -3.99 | -9.7% |
| Other livestock (sheep, goats, etc.) | 7.28 | 6.57 | -0.71 | -9.8% |
| Total cash receipts | 392.18 | 356.96 | -35.22 | -9.0% |
| Total government payments | 14.48 | 32.78 | 18.31 | 126.4% |
| Expenses | ||||
| Feed | 59.67 | 58.93 | -0.74 | -1.2% |
| Purchased livestock | 29.85 | 26.56 | -3.29 | -11.0% |
| Fuel and electricity | 18.45 | 18.09 | -0.35 | -1.9% |
| Interest | 18.80 | 17.63 | -1.17 | -6.2% |
| All other expenses | 229.85 | 223.47 | -6.37 | -2.8% |
| Total production expenses | 356.62 | 344.69 | -11.93 | -3.3% |
| Other net farm income | 55.87 | 53.51 | -2.36 | -4.2% |
| Net farm income | 105.91 | 98.56 | -7.35 | -6.9% |
Source: FAPRI (2020a; 2020b; 2020c).
As prices and cash receipts prospects declined in the early months of the pandemic, so too did the outlook for production expenses (Table 2). Changes in the outlook for some categories of expenses are a result of a shift in capital demand or indirectly through COVID-19 impacts on the macroeconomy and oil prices. For some categories of expenses, the reduction is a result of falling prices that are a direct input into another commodity. Reduced demand for cattle results not only in lower prices for slaughter-ready animals but also in lower prices for feeder cattle purchased by feedlots, with expected purchased livestock expenses falling 11.0%, or $3.29 billion. Similarly, lower feed grain prices reduce feed costs for those same animals. Projected feed costs, including grains and oilseed meals, fell a more modest 1.2%, or $0.74 billion.
Other expenses that are tied more closely to commodities outside of agriculture, such as oil prices, were pushed lower by falling demand (and were sharply lower for a period from a supply war between Saudi Arabia and Russia). Lower petroleum prices contributed to lower farm energy (fuel and electricity) expenses, with costs falling 1.9%, or $0.35 billion.
A slowing general economy and the Federal Reserve Bank’s response to it lowered interest rates, resulting in expected cost savings on farm loans. These and other changes and data revisions reduced the outlook for expenses by $11.93 billion, a change that offset a portion of the decline in farm receipts.
The government response to the pandemic also offset expected reductions in cash receipts. Government direct payments were originally anticipated to be $14.5 billion in 2020, down significantly from the prior year, as no new Market Facilitation Payments were assumed with the signing of the Phase One trade agreement with China (U.S. Department of Agriculture, 2020b).
As COVID-19 spread and the outlook for cash receipts worsened, existing government countercyclical payment programs for program crops offset a small portion of the decline in receipts from the market. The vast majority of the increase in projected government direct payments for calendar year 2020 was a result of programs announced as a result of the unfolding COVID-19 crisis.
The Coronavirus Aid, Relief, and Economic Security Act (CARES) provided part of the funding used to create the Coronavirus Food Assistance Program (CFAP), which also tapped the borrowing authority of the Commodity Credit Corporation (CCC). The first round of the program (CFAP1) was to provide up to $16 billion to agricultural producers (U.S. Department of Agriculture, 2020a). The program covered a wide variety of commodities, including program crops, specialty crops, livestock, and dairy. In August, as the program deadline approached, it appeared the funds spent would fall far short of the program authorization of $16 billion in expenditures, and $11 billion in outlays was assumed in the projections of government payments and farm income. Payment limitations, adjusted gross income (AGI) eligibility restrictions, and less than full participation meant that as of late April 2021, $10.6 billion had been paid out, with little additional anticipated.
In addition, forgivable loans from the Payroll Protection Program (PPP) totaling an estimated $5.8 billion were directed toward agricultural producers and, along with increases in ARC and PLC payments, increased the amount of expected direct government payments by $18.3 billion to a record $32.8 billion.
The reduction in expenses and the additional direct government payments including CFAP 1 and PPP offset some, but not all, of the decline in crop and livestock receipts, resulting in a farm income outlook for 2020 that was $7.35 billion lower than the pre-COVID-19 estimate but still $14.8 billion higher than farm income for 2019.
A lot has changed since the August projections for farm commodity markets and farm income were prepared. Most of the changes that have occurred have supported commodity prices and farm income.
COVID-related effects will continue to impact agricultural markets in 2021 and beyond. In early 2021, vehicle miles driven and fuel use remained below pre-pandemic levels, with implications for biofuel demand. Livestock sector responses to the supply disruptions of early 2020 continue to have meat and milk supply impacts in 2021. Additional relief and stimulus packages boost consumer income and provide additional government payments to farmers.
For the most part, though, the impact of COVID-related factors on farm commodity markets and farm income appeared to be fading in early 2021. Once again, the outlook for farm commodity markets will be driven by the “usual” sources of uncertainty, such as the weather. Until, of course, the next once-in-a-lifetime event occurs.
Agriculture Improvement Act of 2018. 2018. Public Law No: 115-334.
Dunn, E. 2020, June 16. “When Bakers Demanded More Flour, King Arthur Went to the Mills.” Bloomberg Businessweek. Available online: https://www.bloomberg.com/news/features/2020-06-16/how-king-arthur-dealt-with-a-flour-shortage-during-the-pandemic
Food and Agricultural Policy Research Institute. 2020a. “U.S. Agricultural Market Outlook: Trade Friction Baseline and a Phase 1 Scenario.” Columbia, MO: Food and Agricultural Policy Research Institute, FAPRI-MU Report #01-20, March. Available online: https://www.fapri.missouri.edu/publication/2020-u-s-agricultural-market-outlook/.
Food and Agricultural Policy Research Institute. 2020b. “Baseline Update for U.S. Agricultural Markets.” Columbia, MO: Food and Agricultural Policy Research Institute, FAPRI-MU Report #04-20, August. Available online: https://www.fapri.missouri.edu/publication/2020-august-baseline-update-for-u-s-agricultural-markets/.
Food and Agricultural Policy Research Institute. 2020c. “Baseline Update for U.S. Farm Income and the Farm Balance Sheet.” Columbia, MO: Food and Agricultural Policy Research Institute, FAPRI-MU Report #05-20, September. Available online: https://www.fapri.missouri.edu/publication/4444/.
U.S. Department of Agriculture. 2020a. Coronavirus Food Assistance Program. Available online: https://www.farmers.gov/cfap.
U.S. Department of Agriculture. 2020b. “USDA Issues Third Tranche of 2019 MFP Payments.” Press Release, U.S. Department of Agriculture https://www.usda.gov/media/press-releases/2020/02/03/usda-issues-third-tranche-2019-mfp-payments.
World Health Organization. 2020. WHO Timeline - COVID-19. Available online: https://www.who.int/news/item/29-06-2020-covidtimeline.

