Disruptions to food and agricultural trade are not new. The Great Recession of 2007–2009 had marked one of the most significant collapses in trade, with global agricultural trade plummeting almost 20% (almost 30% for nonagricultural exports), yet the economic expansion period that followed was one of the longest on record. In 2018, a trade dispute between the United States and China and several other trading partners led to a significant escalation in applied tariffs and a resulting decline in agricultural and merchandise trade (Bown, 2018, 2019; Amiti, Redding, and Weinstein, 2019; Crowley, 2019; Grant et al., 2019). In 2020, the COVID-19 pandemic challenged the global economy, spreading to 216 countries and regions around the world, decreasing and even shuttering economic activity, and threatening the lives of 7.6 billion people.
In response to the pandemic, national governments imposed unprecedented measures to thwart the spread of COVID-19, including lockdowns, shelter-in-place orders, and the promotion of remote business and education. Many of these policies led to significant economic damage by discouraging large gatherings and outright closures of nonessential businesses including restaurants, bars, shopping centers, and attractions. Recent evidence suggests that lockdowns have worked to slow the spread of the virus but came at considerable economic costs (Fajgelbaum et al., 2020).
Short-term economic indicators are suggestive of a major economic contraction in the United States due to the pandemic not seen since the Great Depression (Orden, 2020). Unemployment burgeoned in just a few weeks from less than 5% to nearly 15% as firms laid off or furloughed workers, and second quarter U.S. GDP estimates showed a contraction of 9.5% (31.4% on an annualized basis).
| All Products |
Vehicle and Parts Thereof |
Aircraft and Parts Thereof |
Electronics | Agriculture | |
| Global Imports (January- December) |
|||||
| 2020 % Change in Imports Relative to 2019 |
-8% | -16% | -33% | -1.6% | 3.5% |
| Value Change ($billions) | -$1,121 | -$160 | -$61 | -$39 | $35 |
| % Change in U.S. Imports | -6.6% | -17.7% | -19.3% | -3.4% | 2.3% |
| % Change in E.U. Imports | -9.9% | -14.5% | -31.2% | 0.65% | 3.4% |
| % Change in China Imports | -1.1% | -1.5% | -50.7% | 10.3% | 18.2% |
Source: Authors' calculation from Trade Data Monitor.
Given the lag in data availability, we are only beginning to observe some of the impacts of COVID-19 on international trade. Table 1 presents data on imports of vehicles and parts, aircrafts, electronics (i.e., TVs and cell phones), and agricultural products, globally and individually for the top three trading nations—the United States, European Union (EU), and China during calendar year 2020 relative to 2019. For all goods (agricultural and nonagricultural), global imports are down 8% year-over-year, or $1.1 trillion in 2020 relative to 2019. For context, the loss of over $1.1 trillion from global trade in 2020 is equivalent to the value of Japan and the United Kingdom’s world imports in any recent year. Total U.S. and E.U. imports are down 6.6% and 10%, respectively, whereas China’s total imports are down 1.1%. Some sectors, however, have been more exposed to the pandemic. For example, the pandemic essentially halted global air travel. Not surprisingly, global imports of aircrafts and related parts are down 33%, or $61 billion, compared to 2019. Notably, China’s aircraft imports in 2020 are down 51%, declining from $19.3 billion in 2019 to $9.5 billion in 2020. Global trade in motor vehicles and parts has also been impacted by the pandemic, as transportation has slowed and the economy has declined, with global imports down 16%, or $160 billion, in 2020 relative to 2019. U.S. imports of motor vehicles are down 18%, compared to 14.5% in the E.U. and 1.5% in China.
Conversely, imports of discretionary electronic items such as TVs, cell phones, monitors, and others are down only 2% year-over-year, or $39 billion. The lower decline of consumer-based electronic products may reflect the fact that consumers can purchase these items online without the need to visit a retail store. Imports of food and agricultural products is one of the bright spots in Table 1, with global trade actually up 3.5% in 2020 compared to 2019. As indicated in Table 1, the overall increase in agricultural imports is driven in part by an 18.2% increase in China’s agricultural imports in 2020. Much of the increase in China’s agricultural imports came initially from Brazil as the real depreciated significantly during the first six months of 2020, followed by significant imports from the U.S. in the fourth quarter of 2020.
In summary, the total trade numbers in 2020 are broadly consistent with an initial outlook the WTO released in April, which forecast declines in the value of global trade in 2020 of -8.1%, -16.5%, and -20.4% under a V- (optimistic), U- (less optimistic), and L-shaped (pessimistic) set of economic recovery scenarios, respectively (WTO, 2020a). In October, the WTO updated the outlook for global trade to fall 9.2% in 2020, with trade growth of 7.2% in 2021 (WTO, 2020b). However, overall declines in global trade mask significant heterogeneity at the country and sector level. For example, the WTO also forecast a significant reduction in the value of agricultural exports by -6.5%, -11.2%, and -12.7% across the three scenarios. Table 1 shows that agricultural trade has not fallen as originally predicted.
The purpose of this article is to conduct an initial ex post examination of the impact of the COVID-19 pandemic on U.S. and global agricultural trade. Specifically, this article addresses the following empirical questions:
This article provides a preliminary econometric examination at how COVID-19 has affected agricultural trade and outlines key impacts that can be observed thus far. As the pandemic is ongoing, the study aims to provide initial evidence of the effects on agricultural trade while pointing to areas requiring more rigorous empirical investigation.

Note: Agricultural export growth reflects products included in
USDA definition of agricultural goods. Data are from Trade
Data Monitor.
Note: Agricultural export growth reflects products included in
USDA's BICO definition of Agricultural and Agricultural related
goods. Non-agricultural trade includes all other HS codes. Data
are from Trade Data Monitor.
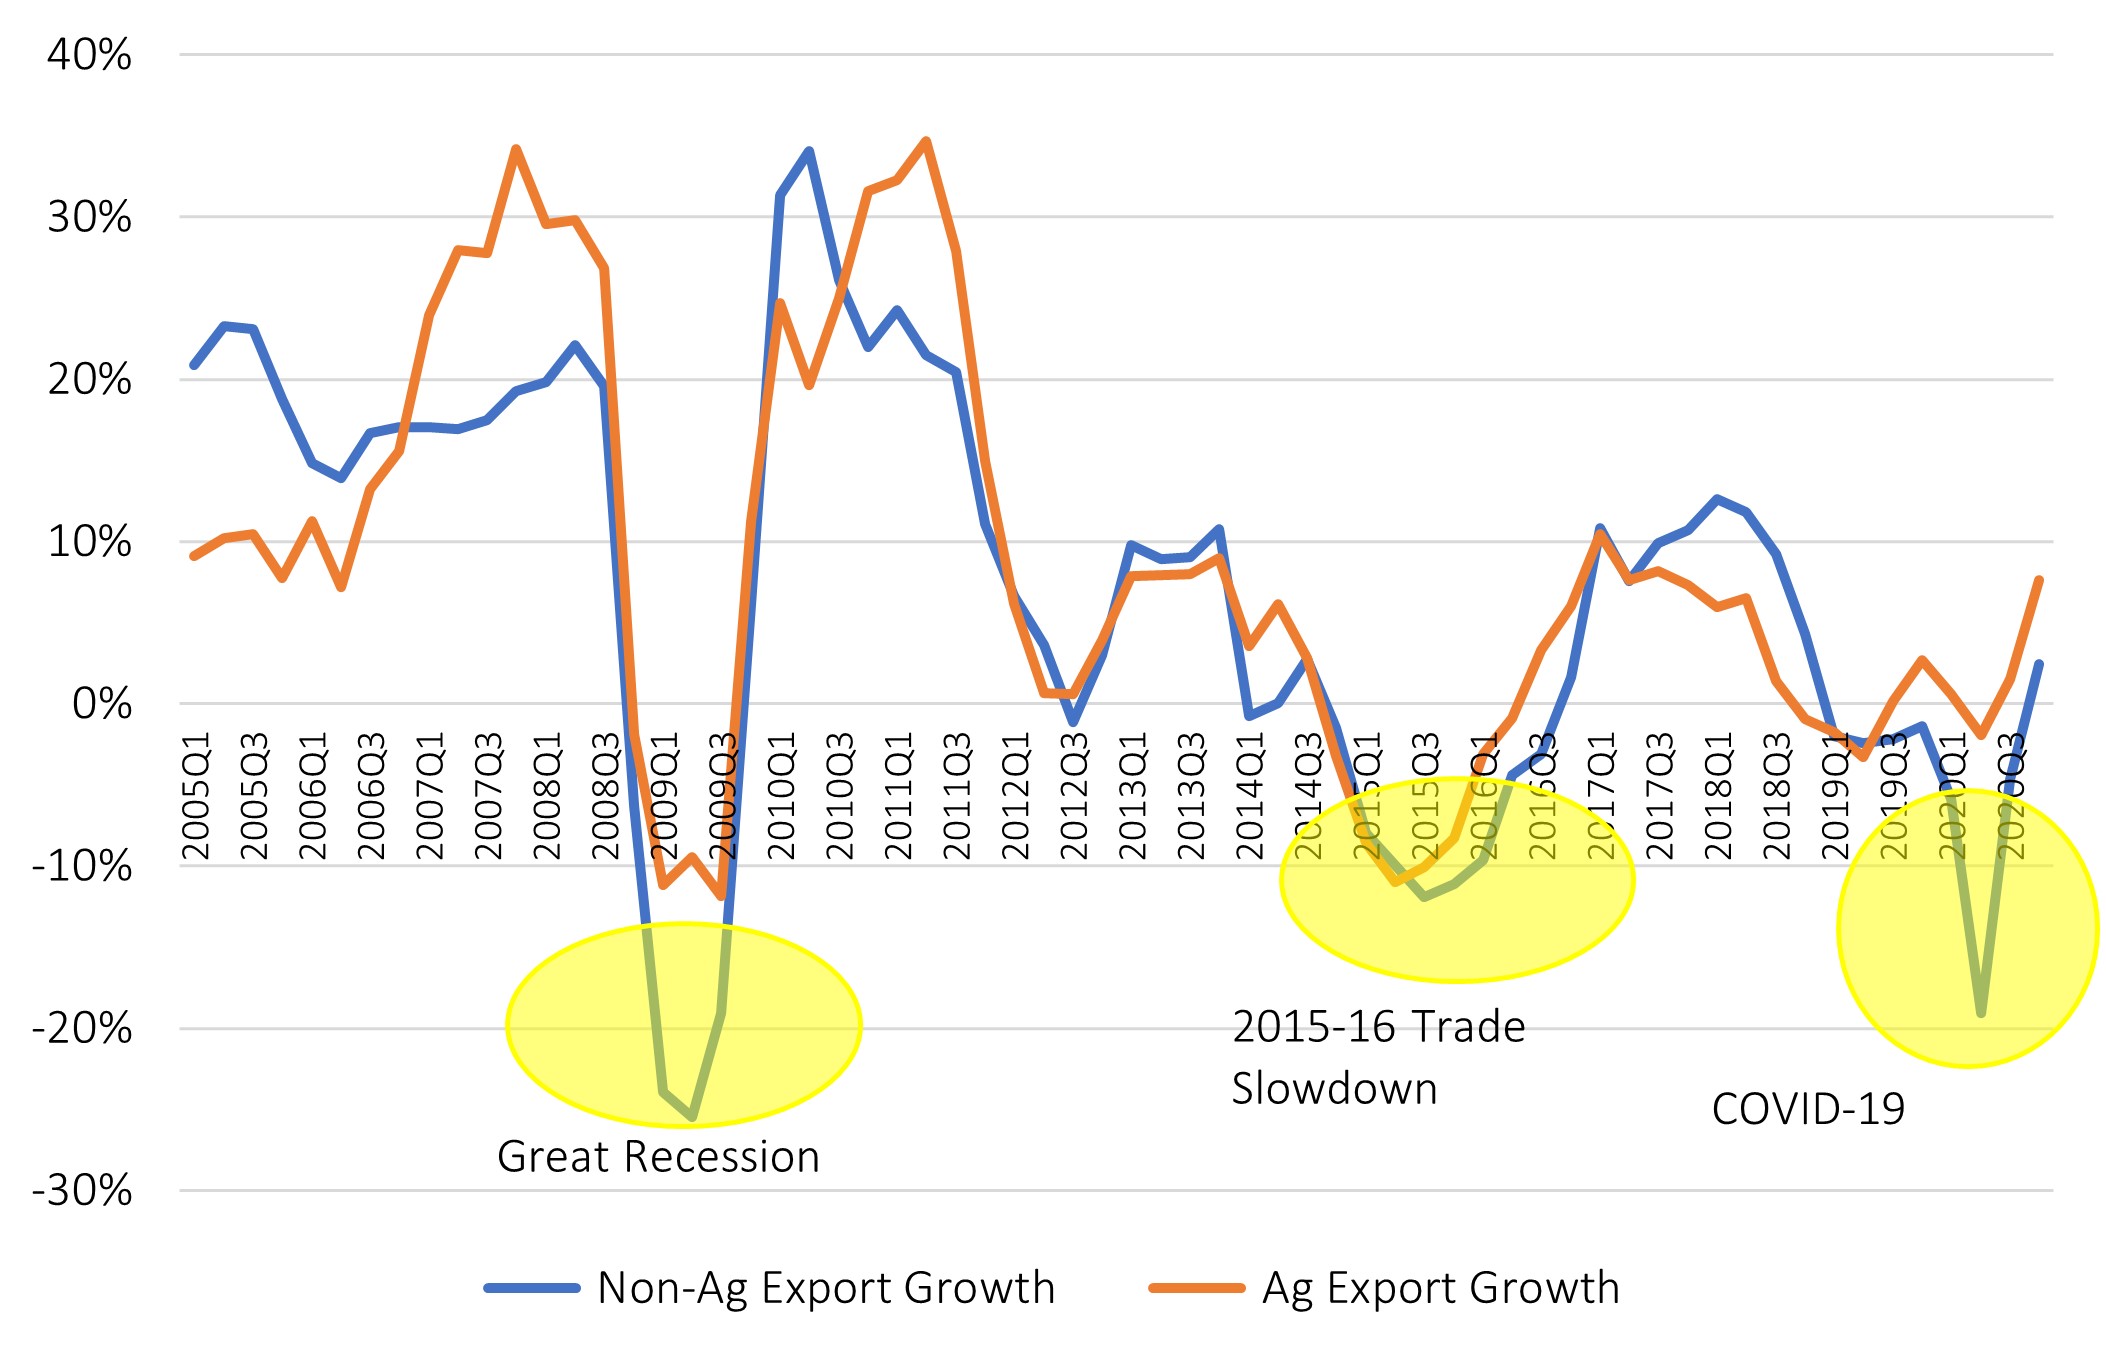
While U.S. agricultural exports during the first half of the year fell relative to the same period in 2019, the decline was not extreme by historic standards, nor in comparison with the steep fall in nonagricultural exports. Following the emergence of COVID-19, agricultural export growth began to slow in first quarter of 2020 with a growth rate of less than 1% relative to the same quarter in 2019 (see Figure 1). As U.S. outbreaks accelerated and lockdowns ensued, second quarter agricultural exports declined much further, 9%, relative to the second quarter of 2019. In comparison, U.S. nonagricultural exports plummeted 32% in the same quarter. U.S. agricultural exports experienced a significant surge during the latter half of 2020 under strong import demand from China. Factors external to COVID-19, most particularly the U.S.-China Phase 1 agreement and China’s pig herd rebuilding that fueled feed import demand led to U.S. agricultural exports hitting record levels in the fourth quarter. In contrast, non-agricultural export growth only slightly recovered, but remains down over 10% relative to the fourth quarter of 2019.
The smaller impact on agricultural trade may reflect the relatively lower income elasticity of food demand, particularly for staple food items, and the structure of agricultural global value chains which is less fragmented than manufacturing and other merchandise trade. Additionally, agricultural trade, which occurs more substantially through bulk marine shipments, is likely to be less susceptible to disruption to transport restrictions in other sectors that require more human interaction (WTO, 2020c). Growth of global agricultural trade has been relatively more stable than growth in U.S. agricultural exports. Growth in global agricultural exports had been positive for most of 2020. Agricultural trade slowed slightly in quarter two, recovered quickly in quarter three, and picked up significantly in quarter four due to Chinese demand. In comparison, growth in global non-agricultural trade fell as low as 19% in the second quarter and subsequently experienced a recovery by quarter four (see Figure 2).
How does the COVID-19 disruption on agricultural trade compare with other major economic crises over the past two decades? Figures 1 and 2 highlight changes in quarterly export growth under COVID-19 relative to three other signifiant trade shocks: (i) the Great Recession (or global financial crisis); (ii) the 2015–2016 international trade slowdown; and (iii) the 2018–2019 retaliatory tariffs.
In 2008–2009, the global economy suffered a deep recession resulting from the global financial crisis. Sudden drops in demand and supply, credit constraints, and disruptions to global value chains led to one of the sharpest trade collapses ever recorded (Baldwin, 2009). At the peak of this crisis, quarterly U.S agricultural exports plummeted over 21% and global agricultural exports fell over 10%. The much larger reduction in trade that occurred in 2009 was quite stark, particularly when compared to the magnitude of the respective GDP shocks. U.S. quarterly GDP contracted 4% at the height of the Great Recession. In comparison, second quarter GDP in 2020 fell 31.4%, the steepest drop ever recorded, before recovering 33.1% in the third quarter. However, the subsequent drop in U.S. agriculture exports under COVID-19 was much more modest (Figure 1).
Beginning in 2015, commodity prices began to fall from their recent highs, the U.S. dollar appreciated, and the International Monetary Fund (IMF) and others lowered their forecasts for global economic growth. These macro factors led to a significant slowdown in global trade (UNCTAD, 2016), with U.S. and global agricultural exports falling more than 10%, a steeper contraction than that currently observed under COVID-19 (Figure 1).
Beginning in 2018, U.S. agriculture was impacted by unprecedented trade retaliation by China and other key trading partners. In total, over $30 billion of U.S. agricultural exports were subject to retaliatory tariffs imposed in 2018 (Grant et al., 2019). At the lowest point of the trade conflict, U.S. quarterly agricultural exports fell 10% (2018Q4) (Figure 1), which has exceeded the decline in U.S. agricultural exports under the COVID-19 pandemic thus far.

Note: Selected agricultural and related sectors. Quarterly trade
changes are from the same quarter in the previous year:
2019Q2 for COVID-19, and 2008Q3 for the Financial Crisis.
Data are from Trade Data Monitor.

Note: Selected Agricultural & Related Sectors. Data from Trade
Data Monitor.
The impact of COVID-19 on agricultural trade across sectors has been uneven. The sectoral differences are noticeably sharp when one compares the sector-by-sector impacts to the 2008–2009 global financial crisis (Figure 3). Unlike the across-the-board declines observed during the financial crisis, there are clear differences across sectors owing to the unique way in which COVID-19 has disrupted demand and supply chains.
First, nonfood agricultural trade has declined significantly more than food products. In particular, hides and skins, cotton, rubber, and nursery products are among the sectors hardest hit by the COVID-19 pandemic. These sectors are more likely to have a higher income elasticity of demand. Further, they are more susceptible to the demand-side shocks of COVID-19 lockdowns. For instance, world retail sales of clothing and textiles plummeted under the weight of closures of apparel stores, weaker demand for purchases due to stay-at-home orders, and lower incomes as unemployment increased or workers were furloughed.
Second, there is a clear dichotomy between food products more likely to be consumed at home versus those consumed away from home. For example, trade in sectors characterized by high restaurant or food-away-from-home consumption—such as seafood, poultry, and beef products (Binkley and Liu, 2019)—has declined globally. In comparison, trade in staple cereal and protein crops, which are more likely to be consumed at home or serve as intermediate inputs for processing, has increased. Third, the role of workers falling ill in meat-packaging plants and plant closures in the United States, Brazil, and other major meat exporting countries may also weigh on exports due to temporary supply disruptions; however, external from COVID-19 shocks, international trade in pork has been stimulated heavily by the outbreak of African Swine Fever (ASF), which has increased demand from China and other outbreak countries.
Figure 4 presents a sector-by-country matrix of the changes in 2020Q2 trade under COVID-19. The changes in trade across sectors are sorted left to right from sectors experiencing the highest positive global trade growth (pulses) to those impacted with the sharpest decline (hides and skins). Similarly, changes across countries are sorted from countries experiencing the highest overall positive growth (Brazil) under COVID-19 to those suffering the overall steepest contractions (Mozambique). Green indicates positive growth is and red indicates negative growth.
Overall, the changes in trade under COVID-19 are highly variable across both markets and sectors. The matrix seems to suggest that the disruption caused by COVID-19 permeates relatively more across sectors rather than across countries. We can see this in the figure by the higher clustering of trade contractions (highlighted in red) being more concentrated on the right side of the table than on the left side. Further, there does not appear to be a clear relationship between the regional variation in the severity of COVID-19 outbreaks relative to observed export changes. For instance, Brazil, which has been one of the countries hardest hit by the coronavirus, experienced the strongest export growth, whereas Mozambique had fairly limited outbreaks despite experiencing the largest contraction. The patterns behind the variation across exporters are not clearly evident but likely depend on the production composition in a given exporting country.
The previous findings were based on the delta or simple change of agricultural exports before and after the coronavirus pandemic. However, percentage changes cannot tell us whether the coronavirus pandemic has had a statistically significant impact on agricultural and nonagricultural trade, nor can it tell us the extent to which agricultural trade varies with changes in different pandemic-related indicators including cases, deaths, and resident mobility within countries. Further, percentage changes do not control for other potential confounding factors influencing agricultural trade such as exchange rate movements, income and GDP shocks, trade agreements (e.g., the U.S.–China Phase One trade deal), or pest and animal disease outbreaks (e.g., ASF or Fall armyworm).
Here, we conduct a straightforward ex post econometric evaluation of the impact of the COVID-19 pandemic on agricultural exports using a quarterly agricultural import model of total (i.e., not bilateral) agricultural and nonagricultural imports from the world market using the latest data available. Specifically, because the COVID-19 pandemic has affected countries at different points in time—beginning in China, spreading to Europe, the United States, and eventually most other countries—we exploit variation in coronavirus case incidence rates per 100,000 individuals.
Specifically, we estimate the following model of total agricultural and nonagricultural imports:
(1) ∆M_(jqt,t-1)^S=FE_j+θ_1 [∆〖COVID〗_(jqt,t-1) ]+ε_iqt,
where ∆Miqt is the change in the value of imports in quarter q and year t between t = 2020 to t-1 = 2019 by importer j in sector S (S = agriculture or nonagriculture), and FEj are importer fixed effects (FE) capturing heterogeneity of country-specific import growth. Note that since the dependent variable is differenced across years, time-invariant unobserved effects specific to each importing country are removed. The main variable of interest is ∆COVIDjqt, denoting the increase in the number of coronavirus cases or deaths reported in importing country j per 100,000 people. Since the COVID-19 pandemic started in 2020, these variables take on positive values in Q1–Q3 of 2020. The coefficient of interest is θ1.
While COVID-19 cases and deaths measure the incidence and spread of coronavirus cases throughout a country, a more direct measure of the economic restrictions imposed by COVID-19 is the degree to which workplace mobility was halted during the pandemic. To explore this association, we make use of Google Mobility data, which track the change in resident mobility trends associated with grocery and pharmacy, parks, transit stations, retail and recreation, places of residence, and places of work on a percentage change basis (Google, LLC). Google maintains these data for over 130 countries worldwide (excluding China).
These data are measured in percentage changes relative to the median baseline value for the corresponding day of the week, during the five-week period from January 3 through February 6, 2020. We aggregate the mobility data to the quarterly level to match the periodicity of the trade flow data. We then computed the percentage change in agricultural and nonagricultural imports for each country for Q1-Q3 2020 relative to the same period in 2019, so that both Google Mobility data and trade flows are expressed as percentage changes (i.e., ∆Miqt, equation 1).
Note: Figure presents scatter plots of the percentage change in
nonagricultural (Non-Ag) and agricultural (Ag) imports against
percentage changes in Google's workplace mobility trend. A
linear lin of best fit is added and the equation Q1, Q2, and Q3
denote quarter one, two and three of 2020, respectively.
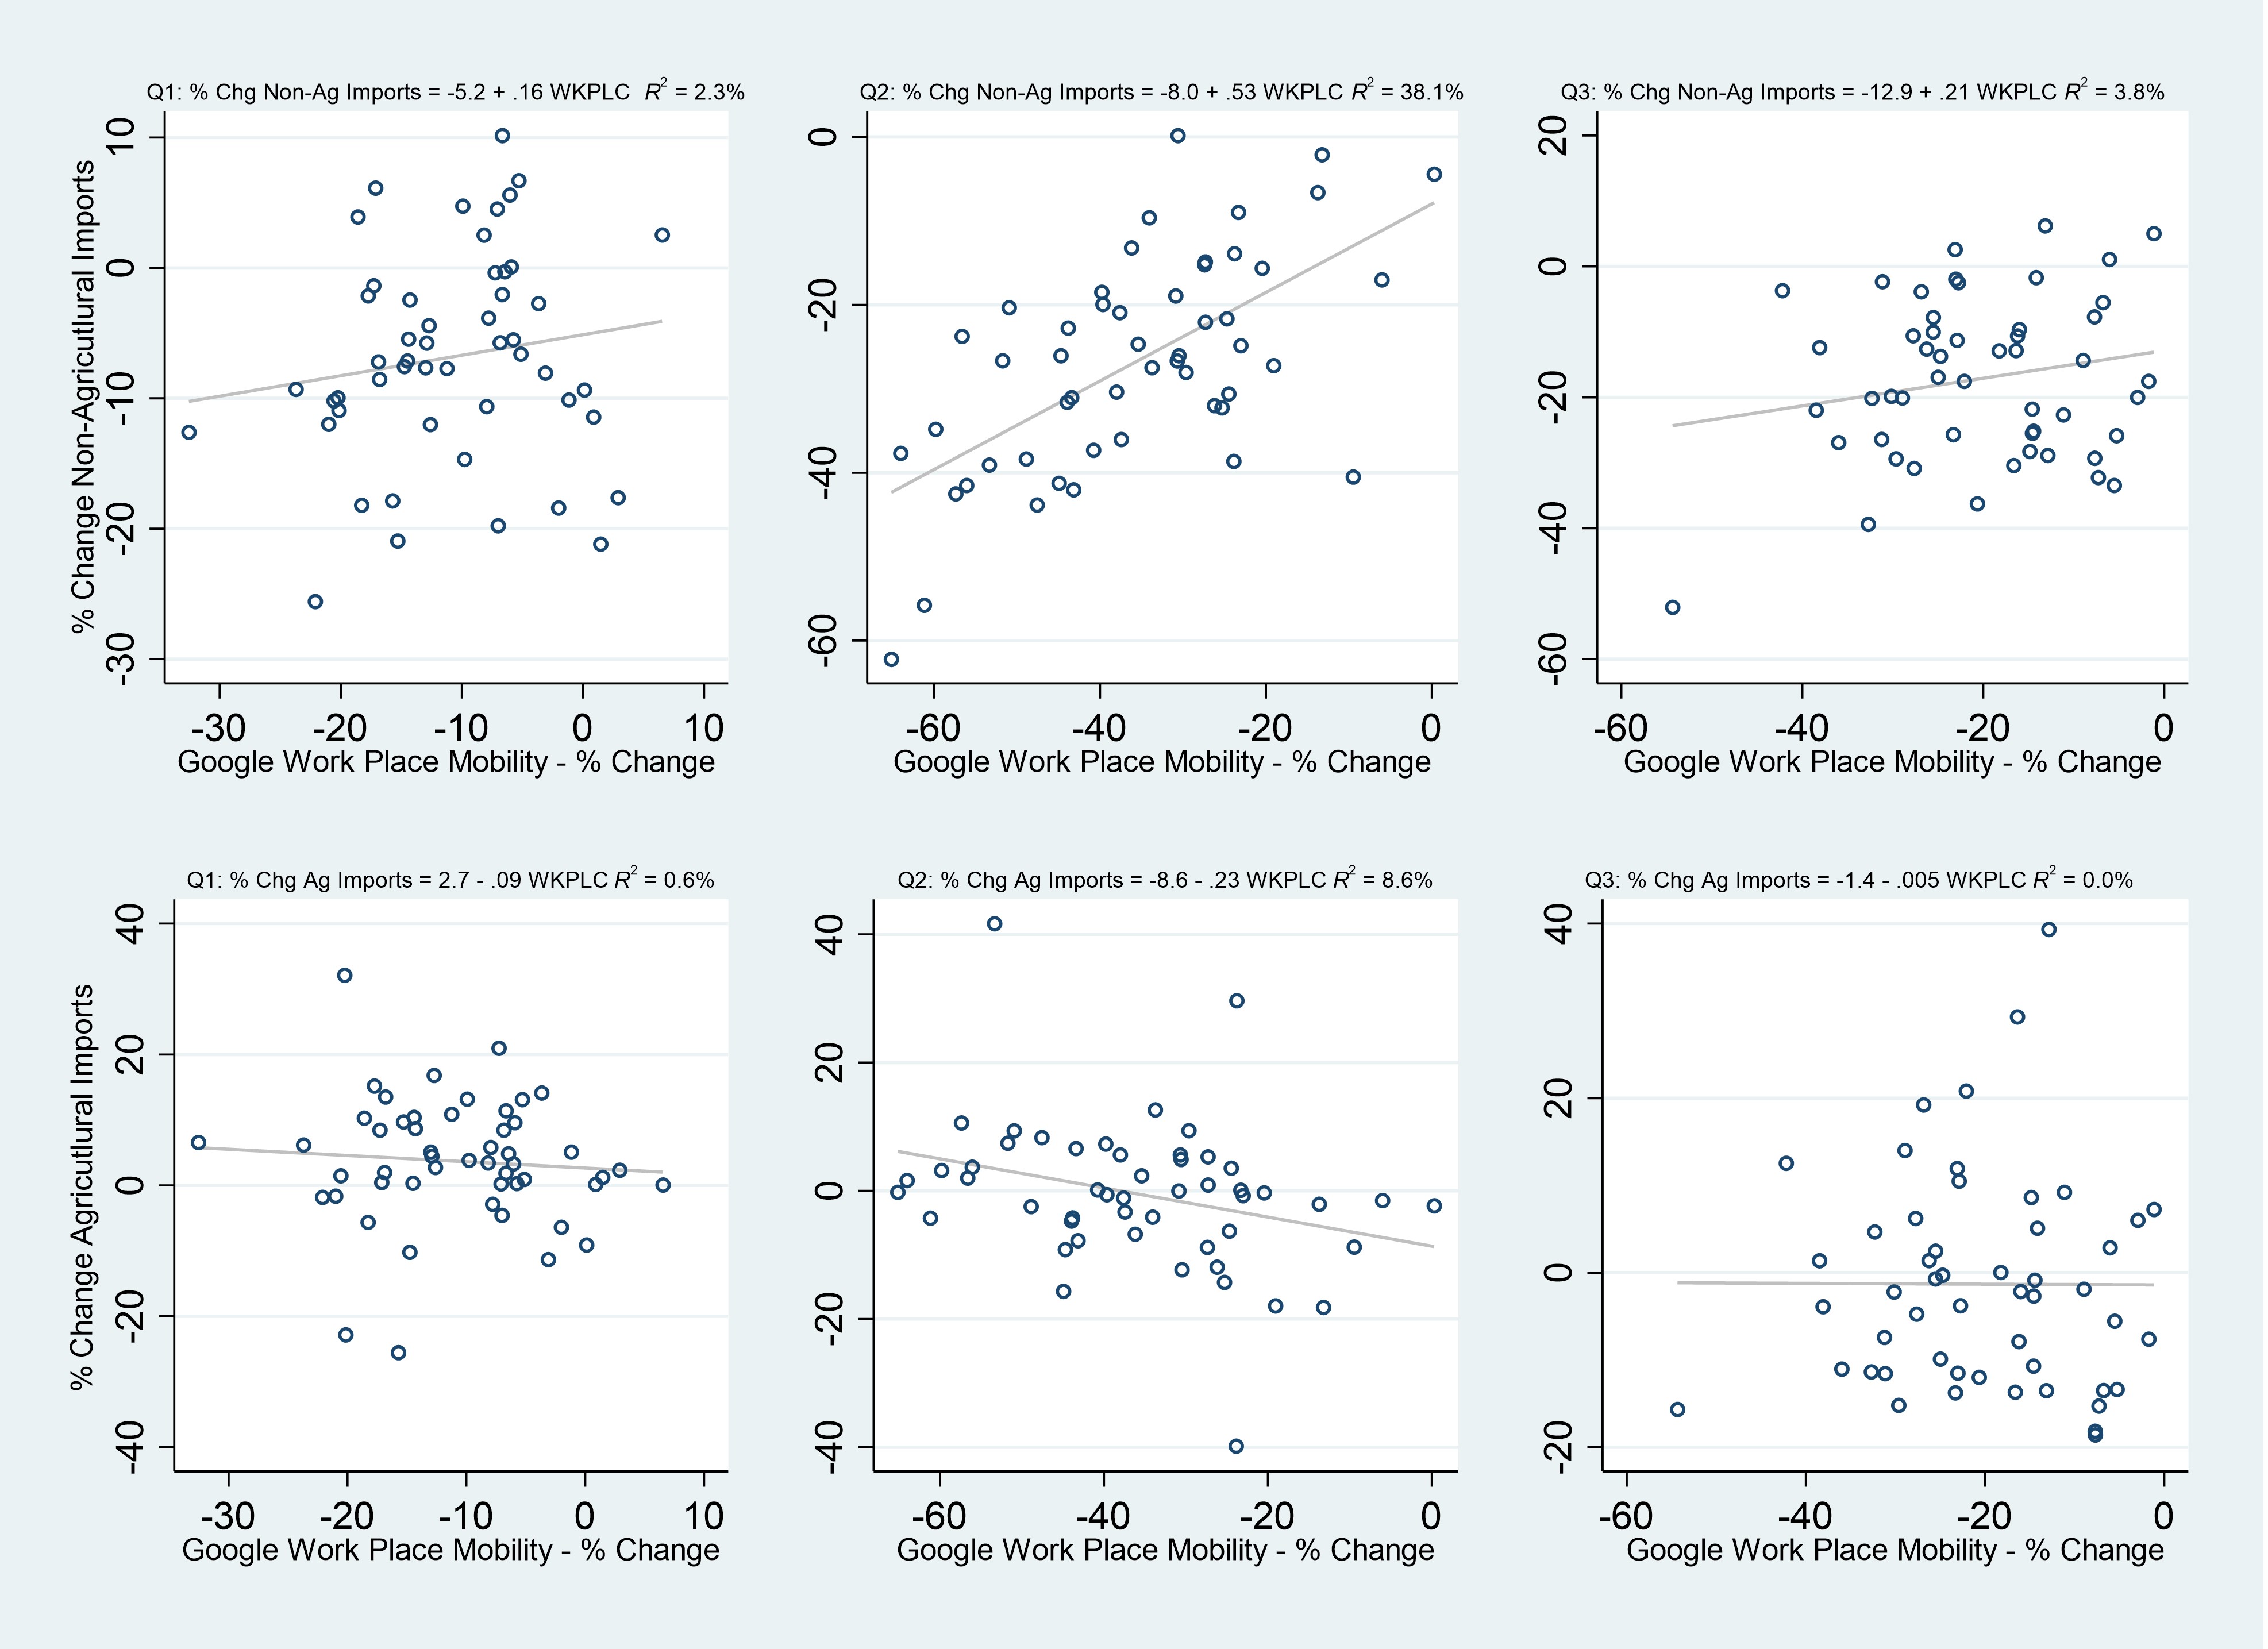
Figure 5 provides a scatter plot of the relationship between the percentage change in the value of nonagricultural and agricultural imports relative to 2019 against Google’s workplace mobility trends (also measured as a percentage change). Also plotted is the linear fit equation (i.e., line of best fit) of the scatterplot. A priori, if COVID-19 has disrupted trade through reduced workplace mobility, then we would expect to see a positive association between trade and mobility (that is, trade is increasing with increasing mobility). The scatterplots in Figure 5 indicate that the positive relationship between imports and mobility only holds for nonagricultural trade. The correlation between agricultural trade and workplace mobility, on the other hand, is weak and in some cases negative (Q2, Figure 5). It appears that agriculture trade has by and large remained robust during the pandemic. For nonagricultural trade, the effect is particularly pronounced in Q2 of 2020 relative to the same quarter in 2019. Across all importing countries, we find that nonagricultural imports are 5.3% lower, on average, for every 10% reduction in workplace mobility due to lockdowns imposed during the global pandemic. The R2 implies that mobility explains 38.1% of the variation of nonagricultural trade changes in Q2, compared to just 8.6% for agricultural trade.
The econometric analysis attempts to isolate the impact of the pandemic on trade by controlling for other confounding factors using fixed effects. Table 2 presents the econometric results after estimation of equation (1) by agricultural and nonagricultural sector. Country-level fixed effects are included in all specifications but not reported. The first set of specifications shows that the effect of COVID-19 on trade as captured by the number of confirmed case and death counts is significant but very small. Projecting the estimated coefficients in columns 1 and 3 on the mean levels of case and death counts for the second and third quarters of 2020, implies a quantitative effect of -2.7% and -2.4% reduction of agricultural trade, respectively. The implied impact is likely driven by commodity price changes, which have fallen significantly for many agricultural sectors during this period. The impacts of COVID-19 case and death counts on the value of nonagricultural trade are larger in magnitude, at -4.3% and -3.6% (columns 2 and 4, respectively).
The estimates based on COVID-19 incidence likely understate the impact on trade since they do not reflect the overarching economic repercussions of the pandemic. As explained earlier, the actual economic impact of COVID-19 may be better represented through its lockdown effect on the economy. Using Google retail and workplace mobility traffic as proxies for the economic and trade impacts of COVID-19, we find stronger impacts induced by the pandemic. Estimated coefficients are generally positive and statistically significant—indicating that a decreased mobility is more strongly associated with reductions in imports. The impacts implied by the estimated coefficients on agricultural imports (columns 5 and 7) are similar in magnitude to the COVID-19 case and death counts—implying a 2.5% reduction of imports. However, we find much larger impacts of mobility on nonagricultural trade, with retail and workplace mobility reducing nonagricultural trade by 16.8% and 17.1%, respectively.
As a final note, columns 7 and 8 present the effect of workplace mobility on agricultural and nonagricultural imports while controlling for COVID-19 morbidity. Although the resulting impact of workplace mobility on nonagricultural trade is slightly lower, at 16%, the results underscore the importance of lockdowns and constrained mobility on international trade compared to incidences of COVID-19 deaths. The varying lower results across different proxies suggests COVID-19 involves complex channels in terms of its effects on trade. Despite this complexity, initial estimations suggest a more significant impact on nonagricultural trade; the evidence for agricultural trade is less robust. The resulting aggregate impacts of both indicators on agricultural and nonagricultural trade are -4.2% and -18.7%, respectively.
| Ag | Non-Ag | Ag | Non-Ag | Ag | Non-Ag | Ag | Non-Ag | Ag | Non-Ag | |
| 1 | 2 | 3 | 4 | 5 | 6 | 7 | 8 | 7 | 8 | |
| New cases per 100k | -0.001** | -0.002*** | ||||||||
| New deaths per 100k | -0.035*** | -0.054*** | -0.025** | -0.023** | ||||||
| (0.00) | (0.00) | (0.01) | (0.01) | |||||||
| Mobility-retail | 0.075 | 0.509*** | ||||||||
| (0.06) | (0.04) | |||||||||
| Mobility-workplace | 0.129* | 0.641*** | 0.089 | 0.605*** | ||||||
| (0.07) | (0.05) | (0.07) | (0.05) | |||||||
| No. of obs. | 162 | 162 | 162 | 162 | 150 | 150 | 150 | 150 | 147 | 147 |
| R2 | 0.462 | 0.503 | 0.458 | 0.499 | 0.453 | 0.754 | 0.462 | 0.771 | 0.482 | 0.778 |
| COVID-19 effect on trade for Q2 and Q3 for 2020 | -2.7% | -4.3% | -2.4% | -3.6% | -2.5% | -16.8% | -2.5% | -17.1% | Mobility: -2.5% Deaths: -1.7% |
Mobility: -17.15 Deaths: -1.6% |
Note: Dependent variable is the percentage change in quarterly imports from the same quarter of the previous year. Agricultural sector as defined by USDA. Data include 2019Q1–2020Q3. 2020Q3 includes only July and August. Estimation includes country fixed effects (not reported) and standard errors are in parentheses and robust to clustering by country. Single and double asterisks (*, **) denote statistical significance at the 10% and 5% levels, respectively. Mobility indices are the percentage change in people traffic as reported by Google using a January–February 2020 baseline, averaged by quarter. COVID-19 effect is calculated as the estimated coefficient of the case, death count, or mobility index projected at the mean level of the indicator for 2020Q2 and 2020Q3, averaged across importers.
COVID-19 is affecting global agricultural markets in sharp and unexpected ways. To date, we have observed a slowdown in agricultural trade, but to a much lower degree than nonagricultural trade. Global agricultural trade ended calendar year 2020 up 3.5% compared to global trade in all products which fell 8%. Further the changes in agricultural trade have been more moderate compared to the contraction experienced during the 2008–2009 Great Recession and other recent global trade shocks. The level of disruption is very sectoral in nature—nonfood trade products and food products consumed more intensely away from home have slowed or contracted more significantly than food products consumed at home.
Using data up until August of 2020, we provided a preliminary econometric analysis of the impacts of the pandemic. Controlling for other factors, we estimated that COVID-19 may have reduced agricultural trade by 4.2% in the second and third quarters of 2020. In contrast we found nonagricultural trade was reduced by 18.7%. Our findings provide initial evidence that agricultural trade has been relatively steady amid the global pandemic; however we also note several caveats behind our results and identify areas for ongoing research. First, as the pandemic is still ongoing and vaccination efforts are progressing, the full extent of COVID-19 impacts on agricultural trade are not clear and further empirical analyses would benefit from a longer time span of data. Second, while agricultural trade has been holding up in aggregate, the level of disruptions across commodities and regions is highly uneven and requires further investigation at the disaggregated level. Third, our empirical approach employed a non-bilateral estimation strategy that could not identify demand vs supply shocks nor control for some of the country level effects. Ongoing research currently undertaken by the authors of this study is employing bilateral trade observations and gravity-based econometric techniques with a longer time period of data in an effort to unpack the complex, multidimensional and heterogeneous nature of the pandemic’s effects across regions and commodities.
Amiti, M., S.J. Redding, and D. Weinstein. 2019. “The Impact of the 2018 Trade War on US Prices and Welfare.” Journal of Economics Perspectives 33(4): 187–210.
Baldwin, R. 2009, November 27. “The Great Trade Collapse: What Caused it and What Does it Mean?” VoxEU. Available online: https://voxeu.org/article/great-trade-collapse-what-caused-it-and-what-does-it-mean.
Binkley, J.K., and Y. Liu. 2019. “Food at Home and Away from Home: Commodity Composition, Nutrition Differences, and Differences in Consumers.” Agricultural and Resource Economics Review 48(2): 221–252.
Bown, C.P. 2018, April 19. “Trump’s Trade War Timeline: An Up-to-Date Guide.” Trade and Investment Policy Watch blog, Peterson Institute for International Economics. Available online: https://www.piie.com/blogs/trade-investment-policy-watch/trump-trade-war-china-date-guide.
Bown, C.P. 2019, September 20. “US-China Trade War: The Guns of August.” Trade and Investment Policy Watch blog, Peterson Institute for International Economics. Available online: https://www.piie.com/blogs/trade-and-investment-policy-watch/us-china-trade-war-guns-august.
Crowley, M.A. 2019. Trade War: The Clash of Economic Systems Threatening Global Prosperity. London, UK: Centre for Economic Policy Research Press.
Fajgelbaum, P., A. Khandelwal, W. Kim, C. Mantovani, and E. Schaal. 2020. “Optimal Lockdown in a Commuting Network.” NBER Working Paper 27441.
Grant, J., S. Arita, C. Emlinger, S. Sydow, and M.A. Marchant. 2019. “The 2018–2019 Trade Conflict: A One-Year Assessment and Impacts on US Agricultural Exports.” Choices 34(4): 1–8.
Orden, D. 2020. “Resilience Test of the North American Food System.” Canadian Journal of Agricultural Economics 68: 215–217.
United Nations Conference on Trade and Development (UNCTAD). 2016. “Key Indicators and Trends in International Trade 2016.” Available online: https://unctad.org/en/PublicationsLibrary/ditctab2016d3_en.pdf.
World Trade Organization (WTO). 2020a. “Methodology for the WTO Trade Forecast of April 8 2020.” Press Release 855. Available online: https://www.wto.org/english/news_e/pres20_e/methodpr855_e.pdf.
World Trade Organization (WTO). 2020b, October 6. “Trade Shows Signs of Rebound from COVID-10, Recovery Still Uncertain.” Press Release 862. Available online: https://www.wto.org/english/news_e/pres20_e/pr862_e.htm.
World Trade Organization (WTO). 2020c, August 26. “COVID-19 and Agriculture: A Story of Resilience.” Information Note. Available online: https://www.wto.org/english/tratop_e/covid19_e/agric_report_e.pdf

